The Discrimination Paradox
Tiny Frequencies of Acts of Discrimination Can Lead to Lots of People Experiencing Discrimination
Longstanding and attentive subscribers have probably gotten used to me debunking woke nonsense masquerading as science. And lord knows there is plenty of that.
But the woke are not always wrong. This essay is based on ideas developed in two of my team’s published papers (here and here). That second paper is mostly my usual fare, including scientific critiques of research on implicit bias, microaggressions and stereotype threat. But, because sometimes, discrimination and bias are real problems, it also includes a full development of:
The Discrimination Paradox
There are quite good recent studies out there finding both very high and very low levels of racial discrimination. It might seem that something is wrong somewhere. Perhaps there are deep flaws in the studies finding little discrimination but not in the ones finding substantial discrimination (or vice versa) and I simply failed to uncover them. Perhaps the situations are too different to justify any comparison. Perhaps I am ignorant of a vast literature documenting acts of discrimination occurring at massive levels and the studies finding minimal discrimination are rare outliers.
These are all possible. But I don’t think so. Instead, I believe that the studies described below are all strong, credible and generalizable studies – but if that were true, we would have an apparent paradox of strong studies producing seemingly strikingly contrasting findings.
So let’s dive in.
The Meta-Analysis
Audit studies refer to a class of experimental studies, conducted in the real world, wherein targets who are otherwise identical (say, they have identical or equivalent resumes) differ on some demographic characteristic and apply for something (such as a job). It can be almost any demographic characteristic, but herein I focus on those manipulating whether the job applicants are Black or White. The main outcome is whether Black or White applicants are treated similarly or differently (say, via call backs or interviews).
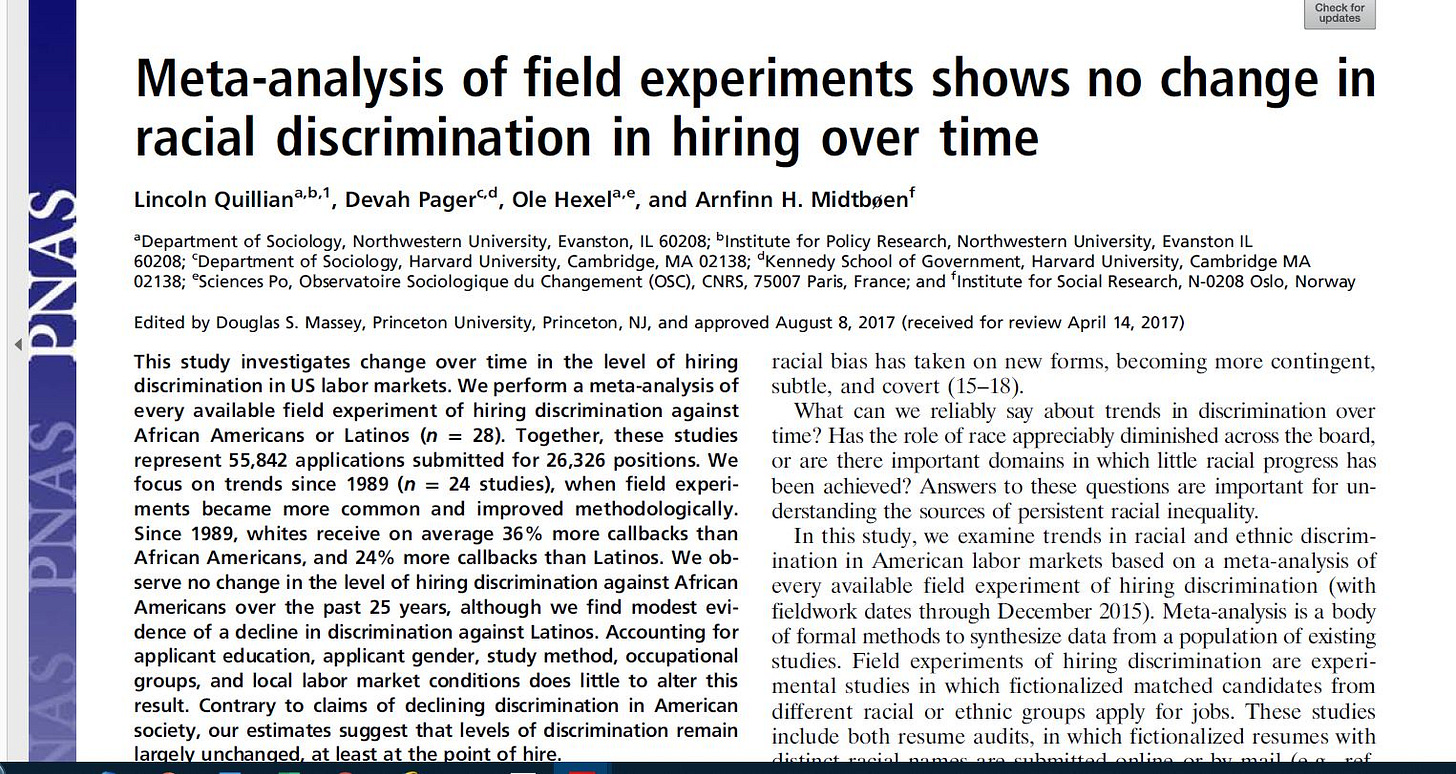
A 2017 review and meta-analysis (Quillian et al, 2017) found 21 audit studies of racial discrimination in hiring since 1989 and three additional ones going back to 1972. The studies included over 55,000 applications submitted for over 26,000 jobs. There were two headline findings: 1. On average, White applicants received 36% more callbacks than did Black applicants. 2. This difference did not decline between either 1972 or 1989 and 2015. Indeed, there was weak evidence that it had actually increased over that time.
Audit studies are not without limitations. They typically assess callbacks or interview requests, rather than actual hiring (applicants are fake so there is no one to hire). They focus mostly on entry level jobs. Still, they have major strengths which mean they should not be dismissed lightly. As actual experiments (rather than surveys, studies of “gaps,” or other correlational type studies) they can assess whether applicant demographics (in this case, race) cause them to receive better or worse employment application treatment. Because they are conducted in the real world, assessing what goes in in real employment situations, they cannot be dismissed as trivial situations concocted in ivory tower laboratories.
36% may not be Jim Crow level discrimination, but it seemed to my co-authors and I (from across the political spectrum) that it was nonetheless quite a lot of discrimination, enough to likely contribute something to racial employment and income gaps. As such, we considered the audit studies of discrimination one of the few bastions of “social justice” research that is actually of high quality.

And yet…
Recent Studies Show Very Low Levels of Acts of Discrimination
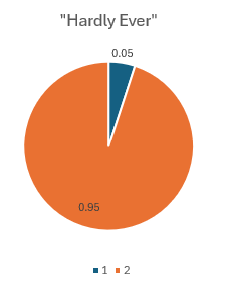
There has been a slew of recent studies showing that racial discrimination hardly ever happens and by “hardly ever” I mean single digits percentwise. Just to help visualize and, I hope, understand this, this chart shows “hardly ever” operationally defined as something occurring 5% of the time:1
Let’s get to the studies.
Ultimatum Game Study
This 2021 study (Peyton & Huber, 2021) found anti-Black discrimination occurred 1.3 percent of the time, which is the same as saying they found no anti-Black discrimination the other 98.7 percent of the time. In the study, they had over 700 people play the ultimatum game with either Black or White partners. This is a game often used in experimental studies. The first player proposes to the second how to divide some money. For example, the first player may be given a dollar to divide, and offers 30 cents to the second. If the second player accepts, then the first gets 70 cents and the second gets 30 cents. If the second rejects this division, neither gets anything. Thus, the first player gives the second an ultimatum: “Take 30 cents or we both get nothing.”
Participants played the ultimatum game 25 times with either Black or White partners, so the total number of offers accepted or refused was over 18,000. Racial discrimination occurred [from the paper:] “when a white individual rejects an offer from a Black individual that would be accepted if offered by a white individual.” This happened 1.3 percent of the time.
The Most Interesting Finding Was Not Highlighted
If you read the abstract, it is all about “racial resentment” and “explicit prejudice.” Indeed, the last sentence declares that “explicit prejudice is widespread.” I am not going to critically evaluate that, so it can, for now, stand. However, what appears next is a screenshot from their paper :
Discrimination occurred 1.3% of the time. Put differently, it did not occur 98.7% of the time. One might wonder why the authors did not highlight this remarkable finding in either the abstract or their discussion. I am sure they have their reasons.
Limitations
The participants in this study were Mechanical Turk workers, which is important because they are not a representative sample of Americans. Whether the 1.3 percent figure would generalize to “Americans” is unknowable from this study. Also, whereas the 98.7 percent nondiscrimination is very high, it was not a real-world context. Although this renders its implications for real-world discrimination unclear, the next two papers addressed discrimination in the real world.
University of Wisconsin-Madison College Student Study
Another study (Campbell & Brauer, 2021), this one of college student behavior as they wandered about their days on campus, was conducted at the University of Wisconsin-Madison. It included five surveys, eight experiments and a meta-analysis2 examining discrimination. Although I focus exclusively on the seven experiments addressing racial discrimination (including discrimination against Muslims), results were similar for the study addressing discrimination against homosexuals. All studies examined naturally-occurring interactions, such as door-holding, asking directions, sitting next to a target on a bus, as students went about their business on campus.
In each study described here, the researchers enlisted an actor3 — someone to play a part in the study unbeknownst to the students whose discriminatory behaviors they assessed. For example, in the racial discrimination studies, they enlisted Black and White actors, so they could compare student behavior towards a Black person or a White person. Some studies compared behavior towards a White person or a Muslim (indicated by a woman wearing a hijab). The actors were trained to behave identically.
The discrimination assessments begin with Study 5, which found that 5% of students held a door for a White person but not for a Black person. Study 6a found that a White actor requesting directions received them 9% more often than an Asian actor and 6% more often than a Muslim actor. In Study 7a, a White actor received help 18% more often than did a Muslim actor, but 20% less often than did an Asian actor. Study 8 found a Muslim actor was treated with more social distance on a bus 6% of the time.
Studies 9a and 9b were job application audit studies (like those of the Quillian et al meta-analysis). Study 9a found that a White applicant received 7% more responses than an Arab applicant; Study 9b found that a White applicant received 8% more responses than did a Black applicant (neither of these differences were statistically significant).
The meta-analysis that included only the Black and Muslim targets was statistically significant, indicating a small overall tendency to favor White targets. Simply averaging the differences for these groups produced an overall discrimination rate of about 8%. Of course, these studies were only conducted among college students at a single university, so their generalizability is unknown.
Discrimination in AirBnb Responses
Nødtvedt et al. (2021) examined discrimination in the selection of Airbnb listings among a nationally representative sample of 801 Norwegians. The host was either identified as ethnically Norwegian or ethnically Somali. Overall, there was a 9.3 percent preference for the listing by the Norwegian ethnic.
Note that the authors (in their Public Significant Statement) declare that “When an identical Airbnb apartment was presented with a racial outgroup…host…[people were] 25% less likely to choose the apartment over a standard hotel.” So how do I get 9.3%? Here is a screenshot from their results section:
Its not that 25% is wrong, its that they are focusing on the percentage difference of the percentages. 28.9 is just about 75% of 38.4, which is how they reached their conclusion that listings by outgroup hosts are 25% “less likely” to be chosen. This is not false. It actually foreshadows the resolution to the Discrimination Paradox. Nonetheless, the percent difference in listings chosen (rather than the percentage difference of the percentages of listings chosen) was 9.3%. Actually 38.4 - 28.9 = 9.5, and even with rounding error, I can’t get it below 9.4, so either I am dense (never underestimate this possibility) or this is a minor error. Still, 9.3 is what is reported, so I am going with it.
Bottom line: acts of discrimination occurred 9.3% of the time. This meant that outgroup hosts were chosen 25% less often. Again, one may wonder why the authors chose to emphasize 25% and not include 9.3 at all in their abstract and general discussion. Again, I am sure they had their reasons.
Of course, this study was conducted in Norway and whether its results generalize to anywhere else is an open empirical question.
Thus the Discrimination Paradox!
Taking these findings altogether, we have the paradox. The high quality meta-analysis of audit studies found job discrimination at 36%; the recent studies reviewed in detail just above, along with many other studies (go here for another meta-analysis; go here for a narrative review) find discrimination at very low levels, typically single digits. This raises the eternal question:
Here is something amazing, at least, I thought it was amazing when I first figured it out:
There is No Discrimination Paradox
The seemingly conflicting findings of the different highlighted studies are completely compatible; there is an apparent conflict, but no actual conflict. Hold on to your hats. It does get a bit mathy, though it does not require any math beyond about 7th grade. But, then, when is the last time you did 7th grade math?
There is no single number for the amount of discrimination a group experiences. Discrimination varies in type (hate crimes, harassment, exclusion, etc.), and there are many different methods for assessing discrimination, which often yield different estimates. Still, to illustrate the discrimination paradox, I need to use actual numbers. I use the 36%, based on the meta-analysis of audit studies of racial discrimination in hiring as the starting point.
Levels of Analysis: Acts of Discrimination versus Experiences of Discrimination
The key to resolving the discrimination paradox is understanding that discrimination can be assessed at two different levels of analysis. The 36% figure obtained by Qullian et al. (2017) is based on the differences in callbacks received by Black and White applicants. That is, it is a difference between the experiences of Black and White applicants. In contrast, the three papers finding single digit discrimination (Campbell & Brauer, 2021; Nøtvedt et al., 2021; Peyton & Huber, 2021) addressed acts by potential perpetrators of discrimination.
Experiences vs. acts. Just try to keep this difference in mind.
Example 1: 500 Black and 500 White Applicants
The importance of distingushing between acts and experiences of discrimination can be readily seen with an example that starts with White applicants receiving 36% more callbacks than did Black applicants (as in the audit study meta-analysis). First consider a simple hypothetical audit study:
There are 1000 applicants for a type of job. There are 500 Black and 500 White applicants with equivalent records. They receive a total of 236 callbacks, combined.
1. If there were no discrimination, Black and White applicants would receive identical numbers of callbacks, 118 in each case.
2. In this hypothetical, I assume Quillian et al. (2017) levels of discrimination, i.e., White applicants receive 36% more callbacks. So White applicants receive 136 callbacks; Black applicants 100. White applicants experienced 36% more callbacks than Black applicants experienced.
3. Remember, if there were no discrimination, both groups would have received 118 call backs. So how much discrimination must be enacted to get to 36%? To get to 36%, i.e., 136 callbacks for White applicants, discriminatory acts need to have occurred 18 times. (118+18=136). But remember, there are 1000 applicants! This means that acts of discrimination occurred 18/1000 times, or 1.8% of the time.
This resolves the discrimination paradox because it shows how 36% discrimination from the target’s standpoint results from acts of discrimination occurring only 1.8% of the time. There is no substantial conflict between the results of Quillian et al’s (2017) meta-analysis, and those of the recent studies finding single digit levels of discrimination.
More Examples
Table 1 displays several alternative scenarios, all showing the same type of thing, whereby 36% of discrimination from the target’s standpoint (or slightly more) results from acts of discrimination occurring in single digits. The first three rows purposely used equal numbers of Black and White applicants to make it easy to see the math underlying the resolution to the discrimination paradox. The second line captures Example I.
The last three rows use numbers that more closely approximate the Black and White population proportions in the U.S. It would get tedious if I walked through it all but it gets a little more complicated when the number of Black and White applicants is not equal. So I will now walk through one example: how I get 37.5% and 0.24% in the last row.
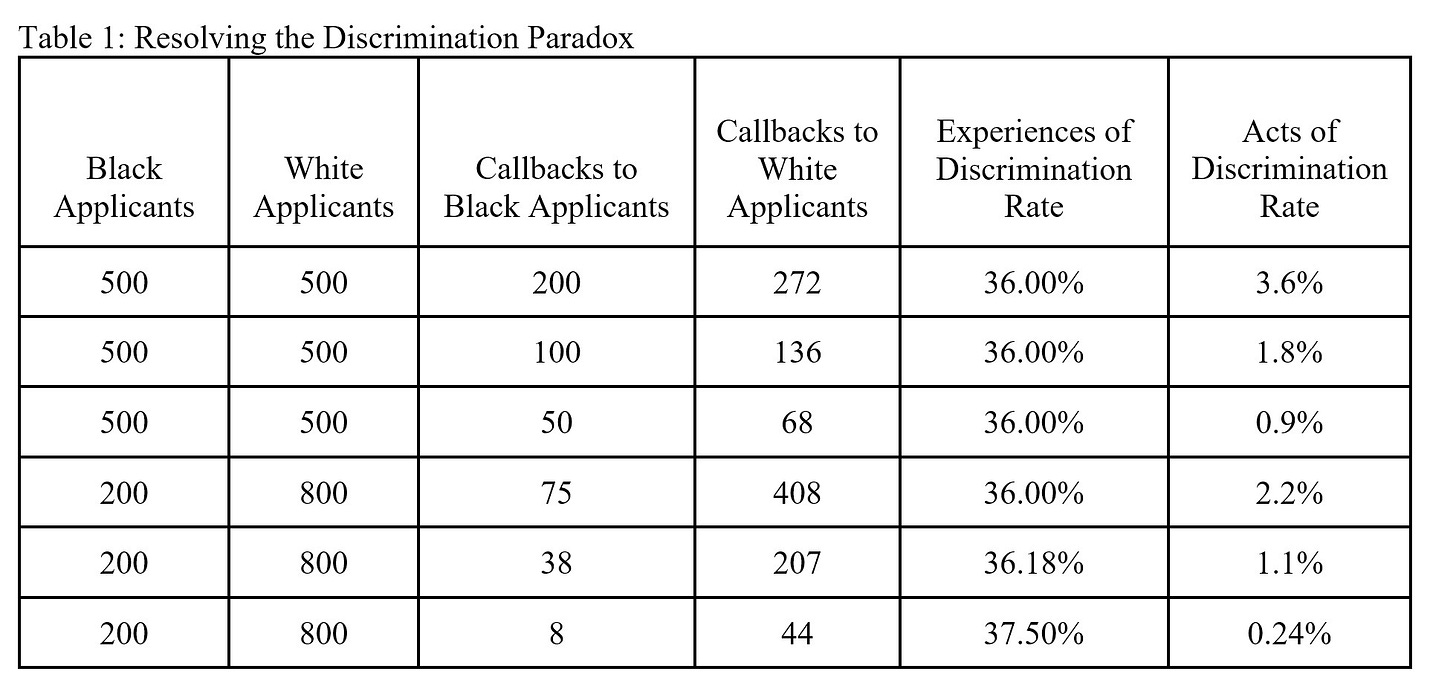
First, where does 37.5% Black victims of discrimination come from? In this example, Black applicants make up 20% of the applicant pool (200/1000), White applicants 80% (800/1000). If there was no discrimination, then, Black applicants would get 20% of the callbacks and White applicants would get 80%. In the example, there are 52 callbacks in total (8 + 44). 20% of 52 is 10.4. 80% of 52 is 41.6. So, in the absence of discrimination, the expected number of callbacks for Black applicants is 10.4; for White applicants, 41.6. Obviously, there are not fractional people, but those are the percentages in the absence of discrimination.
But in this example, Black applicants don’t get 10.4 callbacks. They get 8. 8 is 4% of 200 Black applicants. White applicants don’t get 41.6 callbacks; they get 44, which is 5.5% of 800 White applicants. 5.5 is 37.5% higher than 4.0 (5.5-4.0=1.5; 1.5/4.0=.375). So White applicants received 37.5% more callbacks (relative to their proportion of the applicant pool) than did Black applicants (relative to their proportion of the applicant pool).
So how do we go from 37.5% to 0.24%. This is how:
There are 1000 applicants.
To get from 10.4 callbacks for Black applicants to 8 (in the table), is 2.4. 2.4 acts of discrimination took place. Ok, I realize fractional acts of discrimination in this situation do not really make sense, but what matters is the proportions (see footnote 4 for why).4
2.4/1000=0.24%. Not 24%. Not 2.4%. 0.24%.
Implications
The Discrimination Paradox becomes more extreme when outcomes are more competitive. One of the things notable from Table 1 is that, as the number of callbacks goes down, so does the proportion of acts of discrimination necessary to equal or exceed the 36% rate of experiencing discrimination. This can be seen in a simple example. Consider an example in which 500 applicants were Black and 500 were White, and there were only four callbacks. With no discrimination, 2 callbacks would go to Black applicants and 2 would go to White applicants. A single act of discrimination would mean that only one Black applicant would receive a callback whereas three White applicants would receive a callback. In this case, White applicants are 200% more likely to receive a callback (three versus one), even though there are only 1/1000 or 0.01% acts of discrimination.
Thus, for more competitive selection processes (i.e., where fewer applicants make it into, say, a job or college), minimal levels of acts of discrimination can produce large disparities.
Small biases can be larger than they seem. Another implication is that minimal levels of acts of discrimination can have a substantial impact on the targets of discrimination. There are long running debates about whether even small biases are important. Mostly (though not completely) I think those on the “small biases are important” side are making up self-serving or political-serving arguments to justify the “importance” of their own work that fails to find strong effects.
Mostly. Not completely. The resolution to the discrimination paradox strongly suggests that some small biases do indeed likely produce larger disparities than one might assume, e.g., if one merely knew that acts of discrimination only occur in the single digits.
Everyone is right, even those who find the other side’s views repugnant. The Discrimination Paradox can give some insight into unnecessary socio-political tensions. One side, let’s call them anti-racists, often argue that Black people experience substantial levels of discrimination. Another side, let’s call them racism skeptics, deny this, arguing that discrimination hardly ever occurs here and now, that they do not discriminate personally, that they never or almost never see discrimination in the real world and that the science does not find consistent evidence of strong discrimination. These two sides are often quite hostile to and dismissive of one another. The anti-racists take the racism skeptics’ views as proof that the racism skeptics are actually racists. The racism skeptics take this sort of argument by anti-racists as proof that they are delusional ax-grinders unjustifiably ginning up a moral panic over discrimination.
But the Discrimination Paradox shows that, at least with respect to their understandings of discrimination, they both may well be right, at least some of the time and maybe much of the time. This is a testament to the potential value of different perspectives that come from having different experiences. I am not arguing here for runaway subjectivism. No, Virginia, no one has to take your views seriously just because they are yours. But if Virginia’s views are anchored in an actual reality, albeit a different reality than, say, Norman experiences (and both are seeing pieces of reality), then it behooves all of us to take heed.
“Systemic racism”? The term is in air quotes because it is so casually thrown around among both academics and the wider society that it has become almost impossible to pin someone down as to what they think the term means. Wikipedia defines systemic racism as synonymous with institutional racism — policies and practices that produce discrimination, advantages, or harms to particular groups. I like this definition, because it is reasonably clear. As such, it creates a clear onus on those invoking systemic racism to point to the specific policies or practices producing discrimination. This is rarely done. Instead, systemic racism is often invoked as a quasi-religious dogma that supposedly “explains” inequality — but without identifying the specific policies or practices that cause inequality, the explanation is as scientifically vacuous as answering “Why did the chicken cross the road?” with “It was God’s will.”
It then gets worse, because this term is now all over academia, usually without being defined at all, leaving readers to impute what is meant. As far as I can tell, sometimes it means little more than “gaps exist” because, in the progressive academic mind “gap=systemic ism.” So it is entirely tautological:
Why is there a racial gap? Because of systemic racism.
How do you know there is systemic racism? Because there is a racial gap.
The New Expanded Illustrated Orwelexicon has this type of thinking covered:
Sometimes “systemic racism” seems to be used as a synonym for “racism exists” or “discrimination occurs.” This would seem to be the meaning whenever the person so using the term refers to articles that do not point to any specific institutional or organizational policy but instead cites evidence of prejudice or discrimination. This usage of the term “systemic racism” is a vacuous recycling of the well-known evidence that discrimination exists. It adds neither insight nor explanatory power to anything.
It gets worse. If systemic racism refers to prejudice, this is an attitude, and, therefore, an individual level phenomenon, not an institutional or organizational one. Furthermore, discrimination can and does occur at the individual level, without any institutional or organizational practices involved (as shown by the studies reviewed above).
Thus, to invoke “systemic racism” as an explanation, one cannot point merely to evidence that “discrimination exists.” If A explains B, then A and B must be different variables. If systemic racism explains discrimination, one cannot refer to evidence of discrimination as if it constitutes support for systemic racism.
Last, sometimes the term systemic racism seems to mean there is a lot of racism out there! Racism is “systematic” in its pervasiveness. And yet the work reviewed here on the Discrimination Paradox finds quite the opposite — acts of discrimination are often minimal.
But, given that even such minimal acts of discrimination can produce substantial experiences of discrimination, it raises the questions: What can and should be done to mitigate discrimination?
What to Do?
Wrong Answers Please. Diversity trainings and implicit bias trainings are generally ineffective. The Discrimination Paradox may help explain why – because of a floor effect. If acts of discrimination are as rare as indicated in the studies reviewed above, it is likely to be exceedingly difficult to reduce behaviors with frequencies already near 0 to even less frequent levels. It also seems like a colossal waste of time and effort if nearly all of those subjected to such trainings are already almost never (or never) engaging in discrimination.
Then, of course, there is the preferential selection form of affirmative action. If we know that some group is victimized by discrimination, why not compensate for it with reverse, or, if you prefer, “anti-racist” discrimination? I do think this is a terrible answer for two reasons: 1. It is generally illegal; 2. When demography or victim status becomes a basis for selection for positions that should be entirely merit-based, it creates a work environment likely to be experienced as toxic by anyone except far left progressives — who make up about 5-10% of the population but 40% of academia.
Right Answers? First, no one really knows. Second, there are ample reasons to believe humans have an evolved tendency to be suspicious of (at best) and hostile to (at worst) outgroups (see, e.g., here, here, or here). This does not mean such suspicion or hostility cannot be overcome or unlearned, but it is probably an uphill battle, one that probably will never be completely won — or, put differently, completely eradicating prejudice and discrimination does not seem likely anytime soon.
Third, decades of research on stereotypes and prejudice might be usable to produce better ideas. For example, there is abundant evidence that, when perceivers have and attend to a great deal of relevant individuating information (i.e., information about what someone, say, a job or college applicant is actually like), they overwhelmingly use that information, rather than make judgments based on stereotypes of demographic categories.5 Thus, another strong contender for eliminating discrimination on the job or in admissions is to adopt practices that emphasize focusing on and evaluating merit. This answer is probably imperfect, and will probably reduce but not fully eliminate all discrimination, primarily because some number of people are outright bigots and could not be made to focus exclusively on merit. But it is probably the least bad answer we have so far, because it is likely to accomplish something without being corrosive to the organization or wider society.
Footnotes
Hardly ever. The point of the chart is to easily visualize one version of “hardly ever.” It is not that “5% constitutes an objective threshold for ‘hardly ever.” As stated in the same paragraph in which this footnote appears, “by “hardly ever” I mean single digits percentwise.”
Meta-analysis in Wisconsin study. Meta-analysis is a technique for combining results from multiple studies.
Actors. These were not Hollywood actors. They probably were not even theater students because the paper mentioned nothing of the sort. “Actor” in this context merely means “people who were enlisted to play a role in the study,” not anyone likely to be up for an Oscar anytime soon.
2.4 acts of discrimination? Just scale everything up, using the same proportions, and the results are identical. Let’s say there are 1000 Black applicants and 4000 White applicants. 40 callbacks to Black applicants is 4%, just as in the example used. 220 callbacks to White applicants is 5.5%, just as in the example used. Black applicants receive 37.5% fewer callbacks. If there was no discrimination, Black applicants would have received 20% of the 260 callbacks, i.e., 52. There were 12 acts of discrimination (52-40). 12/5000=0.24%. No fractional people.
Use of individuating information. An unresolved controversy in the literature is whether and when heavy reliance on individuating information reduces but does not eliminate biases produced by stereotypes and prejudice, versus when it completely eliminates such biases. Given the Discrimination Paradox analysis, reducing bias would not accomplish much because, as shown, low frequencies of acts of bias can still produce substantial experiences of bias. Thus, for this to work, conditions would need to be created that maximize the chance of individuating information to eliminate stereotype and prejudice related biases completely.










Such a gift, Jussim. This is a problem that has plagued me for a long time. Thank you for so clearly unravelling it.
There is another potential solution, not discussed here and maybe not generally applicable, but nonetheless coherent with these very interesting findings: make as many domains as possible *less* competitive, and/or provide multiple avenues for success.
Simply put, if the avenue to success and wealth are few and far between, with insufficient capacity for the population, then minimal levels of bias will have an outsize influence. This would call for example for having many more colleges and universities with far less endowment disparity, and therefore effect of the college brand on the professional success. It really should not be the case that to become a US supreme justice you almost need to study at Harvard, or to become a UK MP it really helps to have gone to Eton and then Oxford/Cambridge.
Italy (which however has a lot of different issues with its academic sector) solved this problem with a law which forces the public sector to *not* consider the school awarding the degree for public positions. The older I get, the more I think it is in general a good idea.