
Rigor or Ruin
Sociology’s Reckoning Has Arrived

Lee’s Introduction
Hold on to your hat. This is a long but rewarding one. In which Lawrence Eppard bludgeons bad and biased sociology with the hope, albeit a slim one, of saving the field from itself. The hope is not ridiculous because he is a sociologist and this article exemplifies empirically oriented scientific sociology at its best. Yes, Virginia, scientific sociology is a thing and some still practice it.
This essay was originally published at the Connors Substack, produced by The Connors Institute, a nonpartisan and interdisciplinary effort that strives to “…to disseminate high-quality and consistently nonpartisan information to the American public around issues of societal well-being, democracy promotion, and news literacy.”
Lawrence M. Eppard is an Associate Professor of Sociology and Director of the Connors Institute for Nonpartisan Research & Civic Engagement at Shippensburg University. His scholarship and leadership at Connors focus on cultivating intellectual humility, strengthening standards of evidence and truth-seeking, and fostering a renewed commitment to intellectual integrity within academia and public discourse. He is the author of several books including The Poisoning of the American Mind, Virtuous Lies, and Seeing America Clearly.

Lawrence Eppard
Overview: Sociology confronts an epistemological reckoning that threatens to exhaust whatever credibility the discipline retains. This article—a condensed version of which Eppard gave as a plenary address at the North Central Sociological Association’s (NCSA) 2026 Annual Meeting in Pittsburgh—argues that the social sciences, and sociology most acutely, have normalized a systematic asymmetry in evidentiary standards: permissive toward ideologically congenial claims, stringent toward inconvenient ones. The result is a discipline in which overclaiming, causal overreach, idea laundering, and the conflation of advocacy with empirical inquiry have become endemic. Compounding these epistemological failures are precipitous enrollment declines and the imminent disruption posed by artificial intelligence, which promises to collapse the informational asymmetries that have insulated imprecise academic claims from proper scrutiny.
Sociology might be running out of time to fix itself, and I don’t say that for effect. In fact, we should have changed course a long time ago. I believe the social sciences broadly, and sociology most acutely, have reached an inflection point. Whatever credibility we have built over time, and there is less of it than most of us would like to admit,2 is not guaranteed to survive the next few years. What determines our future is not just what is done to us, but what we decide to do, starting now.
Our discipline faces no shortage of problems that demand serious attention. The one I have been focused on recently,3 and the one I want to make the case for in this article, is the questionable standards of evidence in social science research today. Not in all of it, but in far too much of it. Let me start with an example.
When Claims Outrun the Data
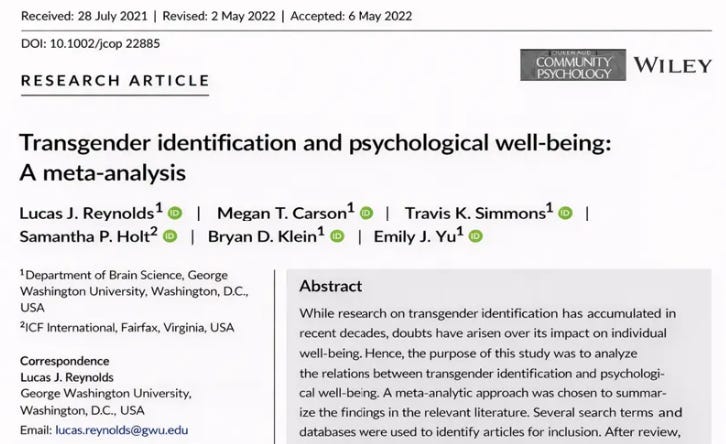
Let’s briefly consider a recent meta-analysis by psychologist Lucas Reynolds and his coauthors titled, “Transgender Identification and Psychological Well-Being.” As I walk you through some of the study’s findings and limitations, I want you to be thinking about whether we should infer a causal relationship between transgender identity and psychological well-being based on this meta-analysis. When I’m finished with this overview, ask yourself: how satisfied am I that we can infer causality from this study?
This meta-analysis synthesized the results of 141 empirical articles, drawing on 154 independent samples and over 30,000 participants. It was published in a peer-reviewed academic journal. The authors included both published and unpublished research and found that publication status did not moderate the results. Whatever this study is finding, we are assuming it is not a file-drawer artifact.
The correlation between transgender identity and psychological well-being (depression, anxiety, stress, suicidal ideation, anger) across all the studies was -0.29. The authors note that, of the 154 samples, only three were experimental and eight longitudinal. They acknowledge in the article that, because so many of the studies relied on cross-sectional designs, they cannot determine causality:
“We cannot conclude that transgender identity caused any of the outcomes examined. The use of experimental and longitudinal designs in this type of research is infrequent.”
The studies in this meta-analysis largely rely on data from participants self-reporting both their gender identity and their mental health status on questionnaires. There is typically no independent verification of either variable. Both the predictor and the outcome usually come from the same person, through the same method, at the same moment.
There is typically no accounting for important confounders. One critical confounder is negative affectivity/ emotionality, a personality trait characterized by a tendency to experience and report more negative emotion, distress, and dissatisfaction across situations.4 People high in negative affectivity/emotionality report more of nearly everything negative, including more discrimination, more stress, more pain, and more health symptoms, independent of objective circumstances. Failing to control for it means that any reported association between a stressor and a negative outcome may be partly or wholly an artifact of the underlying trait.
Despite this, the authors conclude that transgender identity is—and I am using their language—“generally detrimental” to psychological well-being. They describe the findings as evidence of “stable, harmful effects.” They state that “actions should be taken” at the institutional level.
To review: a -0.29 correlation, mostly based on self-reports with no independent verification, overwhelmingly cross-sectional methods, with key confounders not typically controlled. The authors argue that a transgender identity is associated with negative psychological well-being, use borderline quasi-causal language, and recommend taking action, despite writing in the limitations section that the studies they reviewed cannot infer causality.
Editorial aside: When I presented a condensed version of this piece as a plenary address at the North Central Sociological Association’s (NCSA) 2026 Annual Meeting, it was at this point in the address that I asked the audience whether they were satisfied that the meta-analysis I had just briefly summarized demonstrated a causal relationship between transgender identity and poor psychological well-being. Their answer options were “very satisfied,” “somewhat satisfied,” “neither satisfied nor dissatisfied,” “somewhat dissatisfied,” and “very dissatisfied.” From the podium, I estimated that at least 90% of the audience raised their hands to register “very dissatisfied.” Only one person raised a hand for “satisfied” (I cannot recall whether “very” or “somewhat”). Then I revealed that the causal claim they had just rejected was not between transgender identity and psychological well-being, but between microaggressions and psychological well-being.
Every number and every methodological limitation in my description of the meta-analysis was truthful. But, for reasons I will explain, I swapped the topic: instead of transgender identity and psychological well-being, the actual study examined microaggressions and psychological well-being.5
As I said, this is a real meta-analysis. It actually comes from psychologist Paula Costa and her coauthors and was published in the peer-reviewed Journal of Community Psychology.6 It included 141 studies and 154 samples on the relationship between experiencing microaggressions and psychological well-being. The corrected correlation was in fact -0.29.
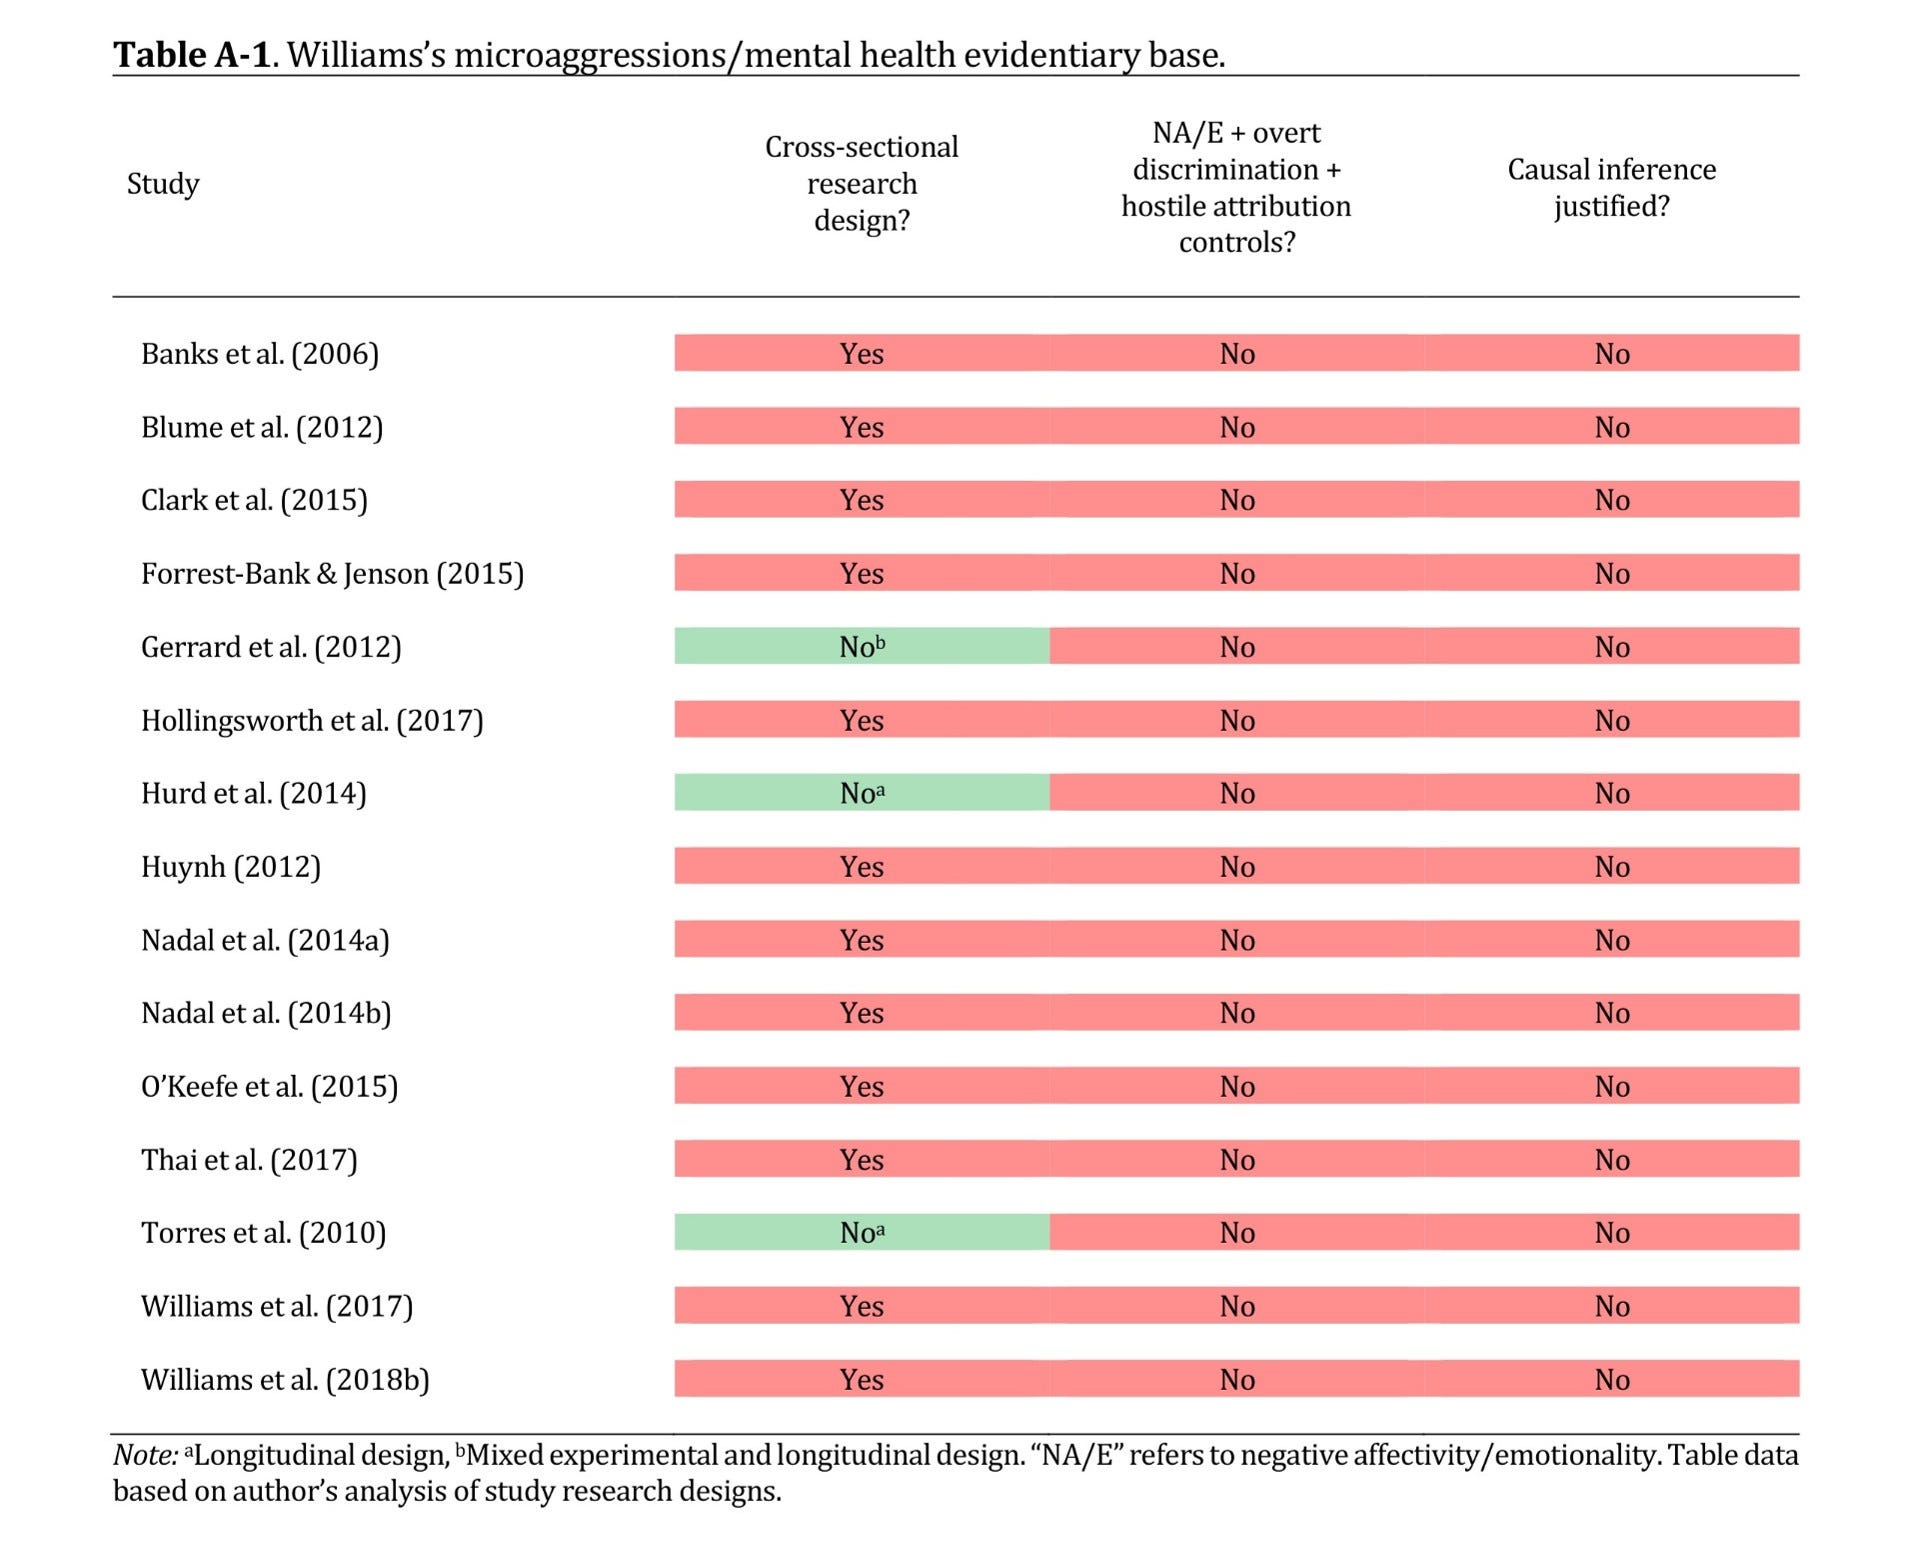
Few studies in the analysis adequately controlled for known confounders, like baseline mental health, negative affectivity/emotionality, hostile attribution bias, or overt discrimination.7 The omission is consequential: without those controls, the resulting effect estimates blend the contribution of microaggressions with the contributions of variables that independently predict psychological distress, and the literature cannot tell us whether microaggressions add any explanatory power of their own. Consider negative affectivity/emotionality, a personality trait characterized by:
“a pervasive temperamental disposition to experience aversive emotions of many kinds, including anxiety, worry, moodiness, guilt, shame, hostility, irritability, and perceived victimization. Individuals with elevated levels of [negative affectivity/ emotionality] tend to be critical and judgmental of both themselves and others, vulnerable to distress and emotional maladjustment, and inclined to focus on the negative aspects of life. They also tend to be vigilant and overreactive to potential stressors and, of particular relevance to the [microaggression research program] given the open-ended nature of many microaggressions, prone to interpreting ambiguous stimuli in a negative light.”8
A person high in negative affectivity/emotionality will both report more negative interpersonal experiences and report worse mental health outcomes, producing a correlation between the latter two that could be largely spurious.9
In most of these studies, we do not have any external verification that a microaggression actually occurred—both the predictor and the outcome tend to be self-reported, from the same person, at the same time.10 We also do not know the direction of causality. Perceived microaggressions could of course degrade one’s psychological state. But it could also be a case of reverse causality—it is certainly plausible that a person’s psychological state can sometimes cause them to perceive microaggressions in innocuous situations. In other words, it would not be surprising if distressed people reported being distressed.11
The authors use borderline quasi-causal language, describing their findings using the words “generally detrimental,” “stable, harmful effects,” and “actions should be taken.” They do this despite acknowledging in their limitations section that:
“[W]e cannot conclude that microaggressions caused any of the outcome variables examined. The use of longitudinal and experimental designs in microaggressions research is infrequent.”12
The data do not begin to establish causation. They can’t, because the dominant research methods do not allow for causal inference.13 The studies in this microaggression meta-analysis establish a largely cross-sectional and almost certainly confounded association. And this was the more compelling of the recent meta-analyses on the topic.14
Many sociologists would balk at any causal interpretation of this meta-analysis if they thought it supported a claim they were predisposed to find objectionable—that transgender identity causes poor psychological well-being. The question is: do we sociologists apply these standards of evidence consistently? I cannot say whether any individual sociologist would be skeptical if they knew from the start that they were evaluating a microaggression meta-analysis, but I do know that our larger field is not as skeptical as it should be about this claim and many similar social science claims that permeate our research and curricula.15
Academics, both individually and collectively, ought to articulate evidentiary thresholds above which a claim warrants acceptance and below which it warrants rejection, and to apply those thresholds consistently. As Robert K. Merton wrote:
“[T]ruth-claims, whatever their source, are to be subjected to preestablished impersonal criteria. . . [A]cceptance or rejection of claims entering the lists of science is not to depend on the personal or social attributes of their protagonist.”16
In practice, however, both in the classroom and in our research, academics routinely apply permissive standards to congenial claims and stringent ones to uncongenial claims.
I used the transgender decoy because many sociologists are likely emotionally invested in it. I did not make this choice lightly. Every decoy I considered was emotionally charged, and I had to choose. But that is the point. We study things that move us, that we are deeply invested in. And that investment often clouds our judgment.
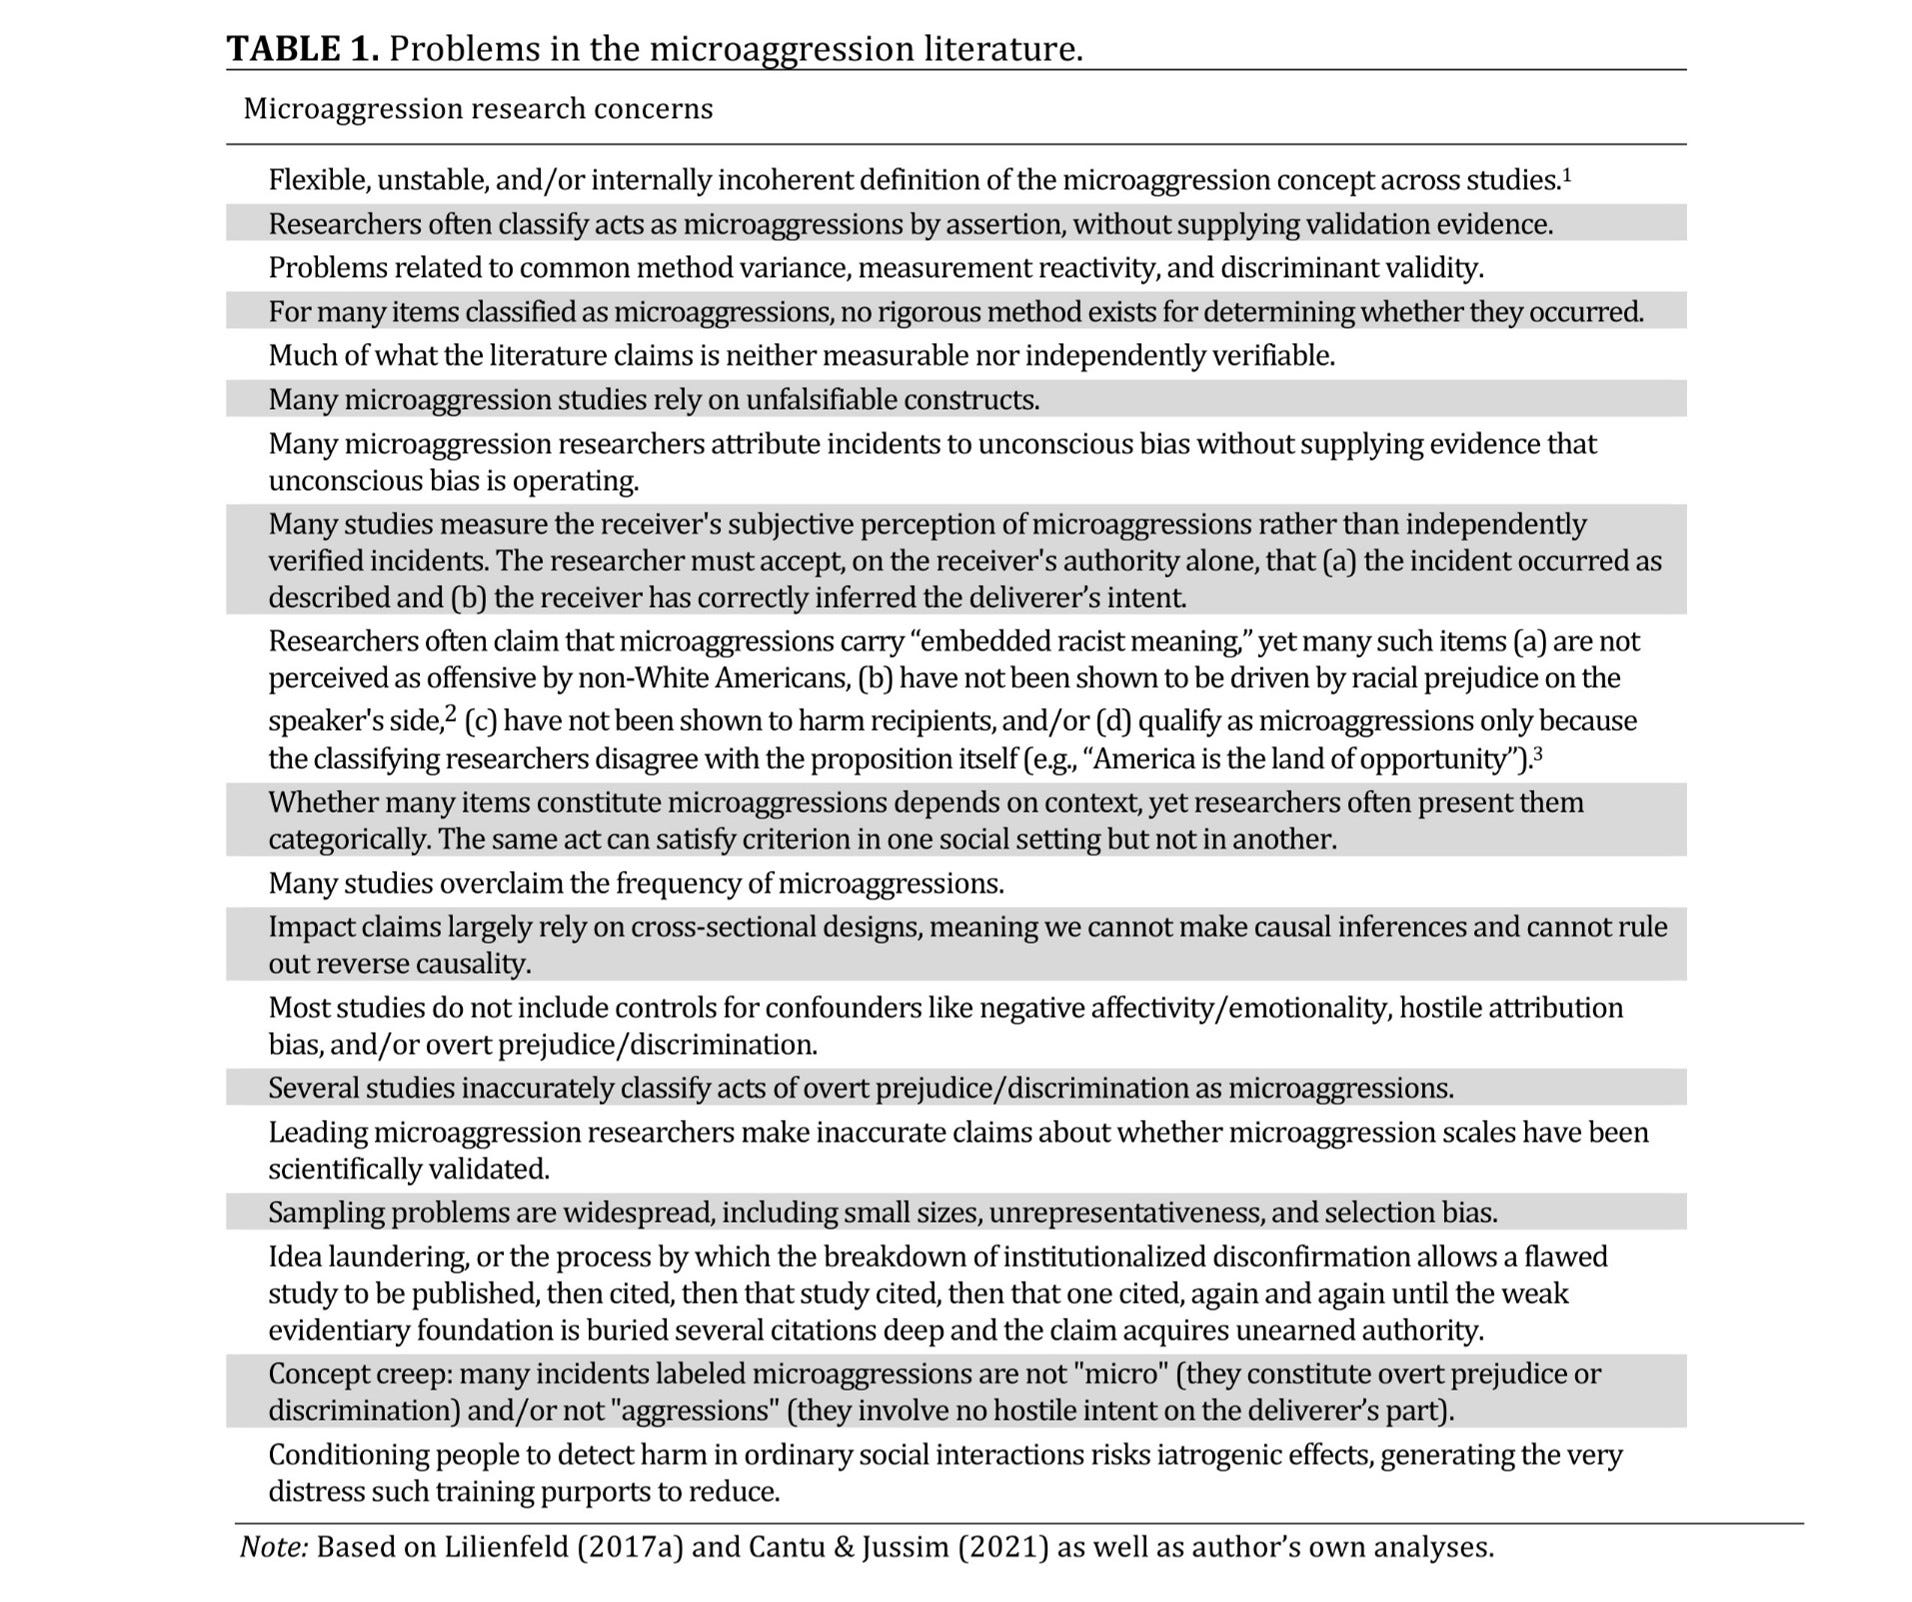
I could have continued the ruse by mentioning more of the problems with microaggression research, as there are numerous other red flags in this literature (see Table 1 below). You find microaggressions like this one, for instance, which requires the self-reporting participant to mind-read intent on the part of the deliverer:
“Someone avoided sitting next to me in a public space (e.g., restaurants, movie theaters, subways, buses) because of my race.”17
Or take this “micro-invalidation,” which in many contexts carries no ill intent and reflects nothing more than a good-faith disagreement about a contested political position, yet is classified as racism:
“Someone told me that people should not think about race anymore.”18
Or “environmental microaggressions”—a category whose fit with the microaggression definition is itself unclear—where simply noticing the demographic composition of one’s workplace or school is coded as a racist experience:
“I observed people of my race in prominent positions at my workplace or school.”19
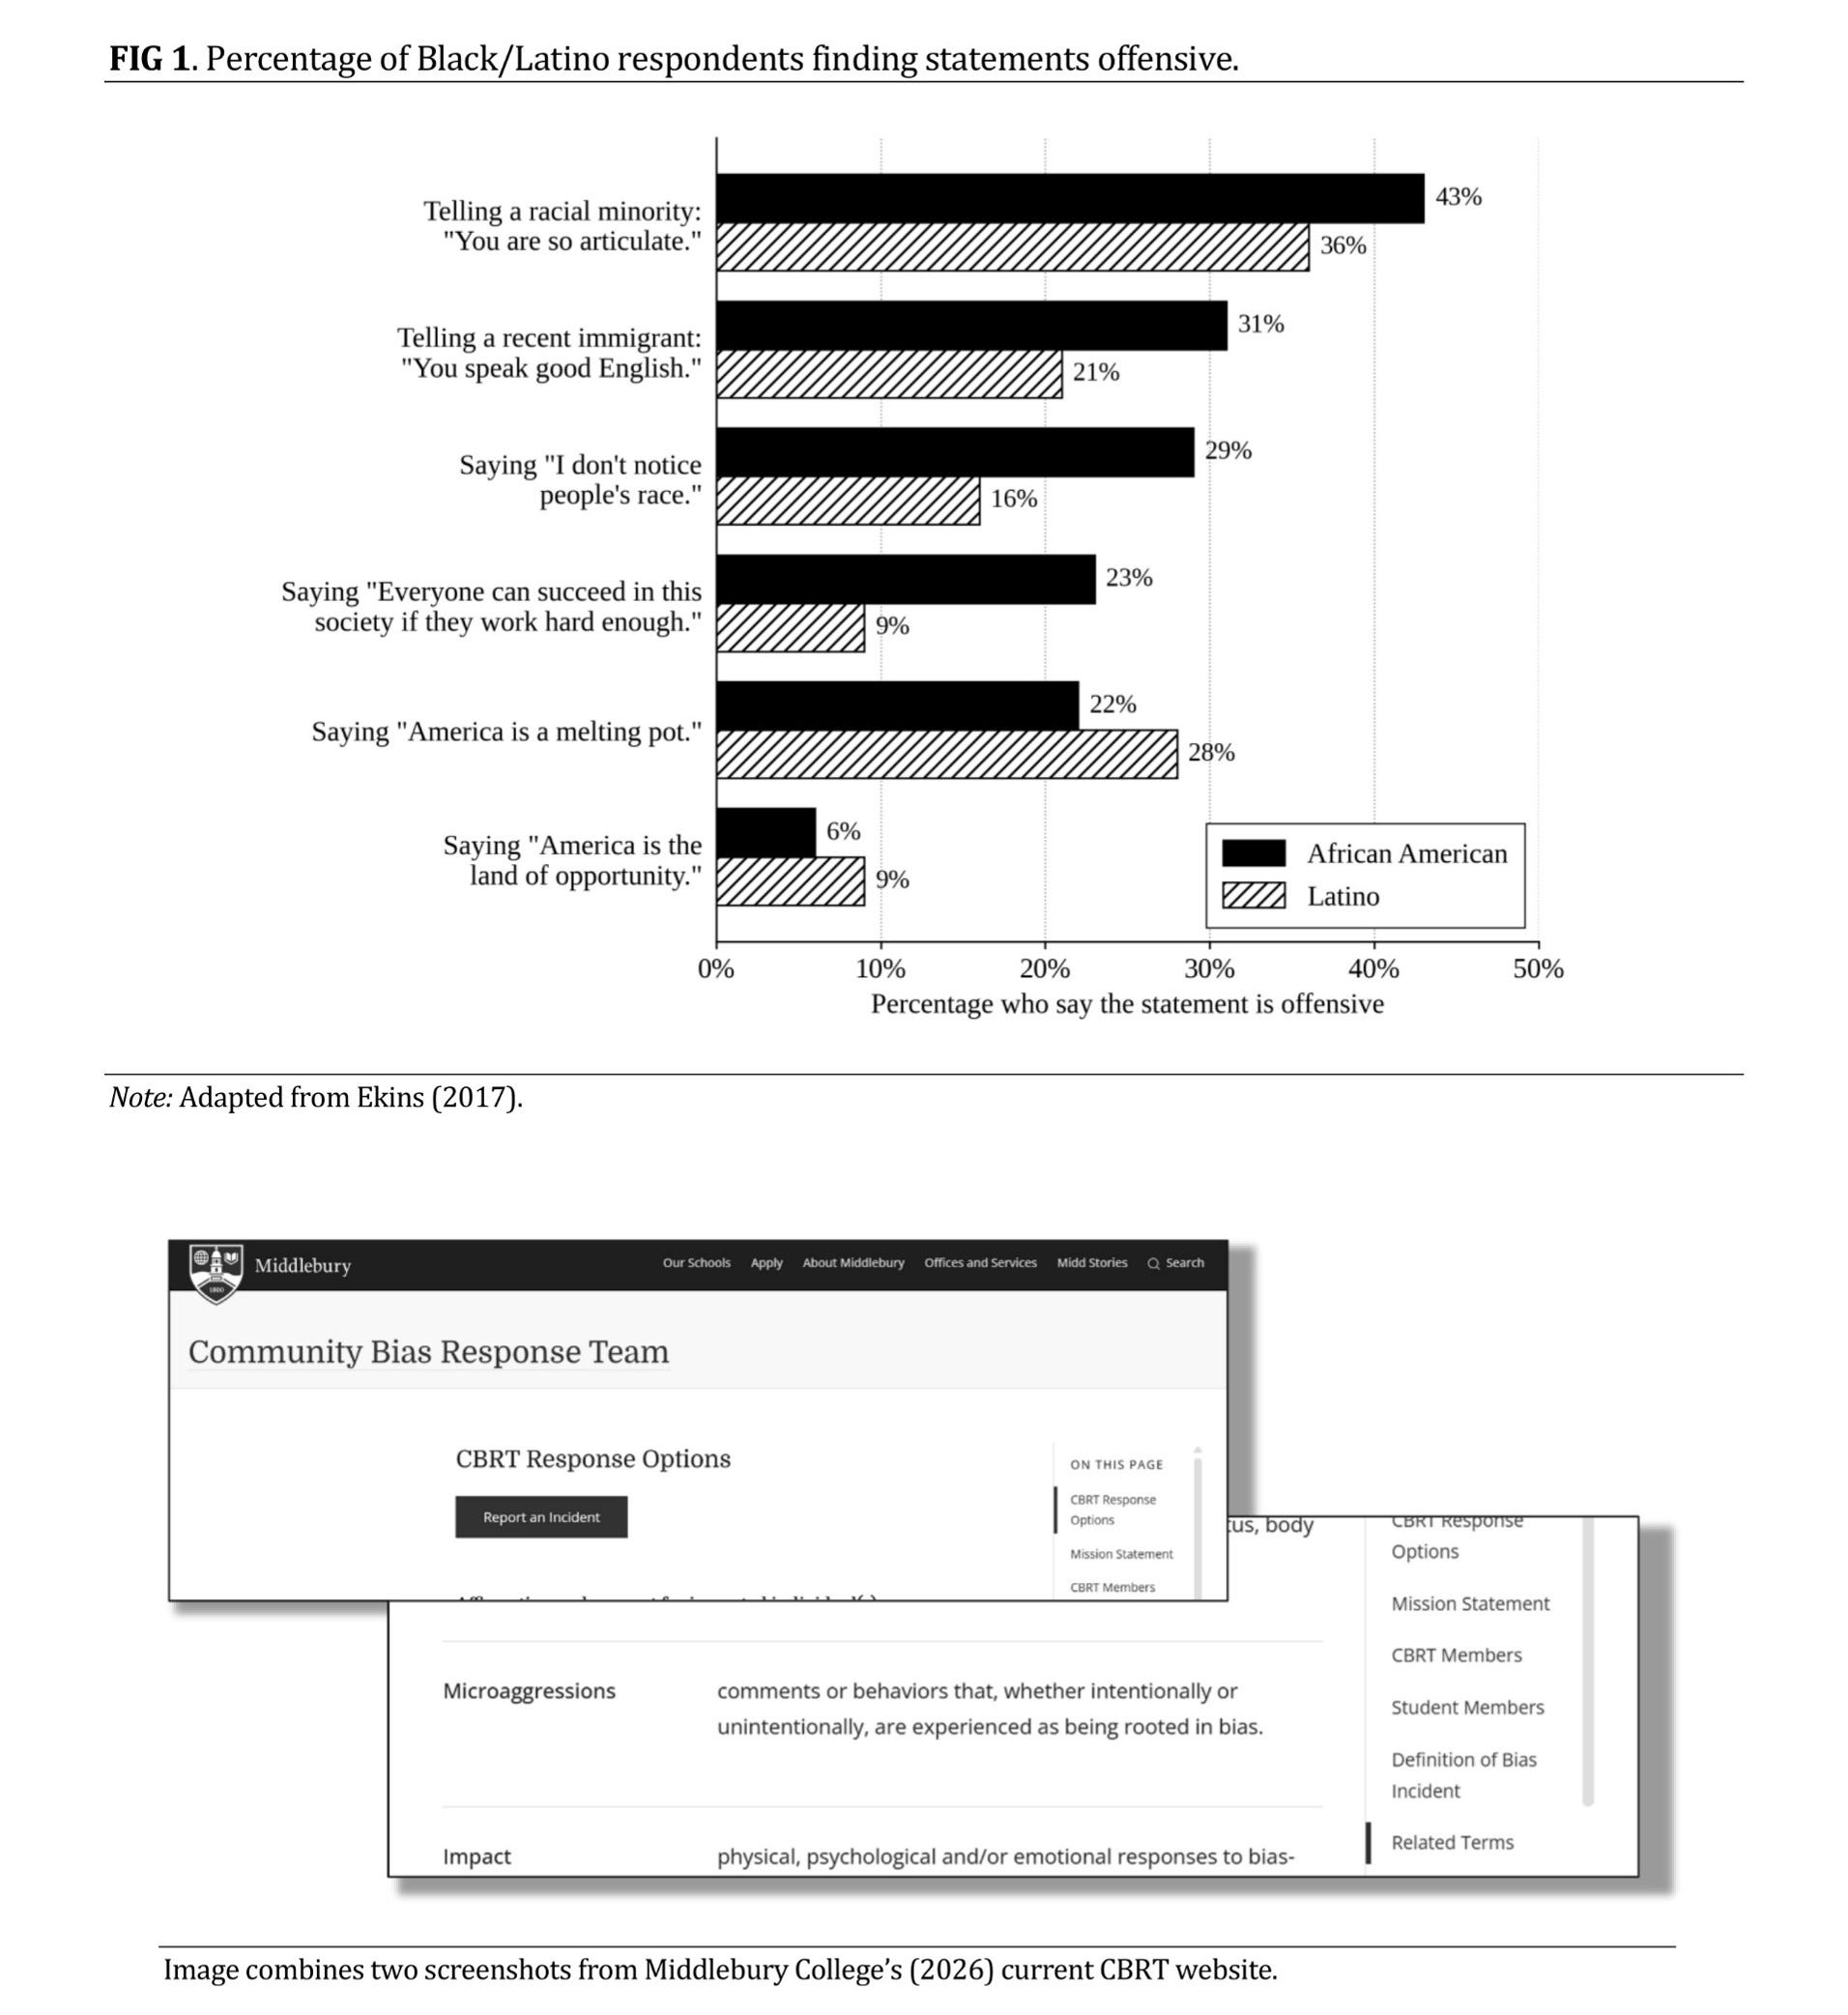
There are items classified as microaggressions that most non-White Americans themselves do not find offensive, such as “America is a melting pot” (see Figure 1 below).
There are leading microaggression researchers who claim that microaggressions happen every day, yet the self-reported data in some of the most-cited studies suggest they are more likely a weekly or monthly occurrence.20
There are even microaggression researchers who argue that methodological critique of microaggression research can itself be a microaggression. Meaning, I suppose, that this very article is a microaggression:
“It would be irresponsible of me as a diversity educator to ignore racist frameworks and approaches embedded in an article about racism. I am not specifically accusing Lilienfeld personally of being racist or having racist motives. By ‘racist frameworks,’ I mean approaches that favor the dominant racial group at the expense of subordinate groups. . . A research framework could itself constitute a microaggression.”21
The red flags surrounding this literature are numerous and severe, yet its claims have caromed through social science classrooms and research alike. An army of academics has built an entire edifice of published research, classroom lectures, campus workshops, and workplace trainings on top of a critically compromised foundation. Few of these academics likely know just how unsound that foundation really is. To quote my colleague, psychologist Lee Jussim:
“[E]ducators, scholars, and administrators have accepted [the prevailing microaggression paradigm] as valid even though psychologists have not established its scientific legitimacy.”22
He adds:
“[W]e recommend that scholars and administrators—and everyone else for that matter—generally refrain from relying on commonly propagated lists of microaggressions as reflecting anything meaningful.”23
This area of research is clearly in its exploratory stages, yet it has already been used to justify an extensive infrastructure of campus and workplace policy across the country. University “bias response teams” are one example—see image below from Middlebury College’s “Community Bias Response Team” website.24 In practice, the microaggression literature is treated by many as though the empirical evidence for intent, frequency, and harm has been firmly established. It has not, and it is not close.
Amicus Plato, sed magis amica veritas
Why do we build research programs and curricula on claims like these without a stronger evidence base? Time and again, alternative hypotheses fit the data as well or better. As T. C. Chamberlin wrote:
“[T]he affections enter with their blinding influence. . . The moment one has offered an original explanation for a phenomenon which seems satisfactory, that moment affection for his intellectual child springs into existence; and as the explanation grows into a definite theory, his parental affections cluster about his intellectual offspring, and it grows more and more dear to him. . . There springs up, also, an unconscious pressing of the theory to make it fit the facts, and a pressing of the facts to make them fit the theory.”25
And as John R. Platt wrote:
“I think, there are other areas of science today that. . . have forgotten the necessity for alternative hypotheses and disproof. Each man has only one branch—or none—on the logical tree, and it twists at random without ever coming to the need for a crucial decision at any point.”26
Why do we systematically choose the ones that support our priors?27
This is a separate problem from the replication crisis. For those unfamiliar, Nature recently reported on a seven-year project that included 3,900 social science papers. Roughly half of the claims they tested failed to replicate.28 The broader literature is large and worth your time, but this is a good place to start.29
What’s troubling is that the microaggression meta-analysis I discussed earlier could replicate perfectly, but the way that many social scientists make use of it would still be wrong. The correlations could hold in a replication attempt, but causal interpretations, and any interventions built on them, would remain unjustified by the data.
I have seen numerous sociologists make huge sweeping claims on campus, in their research, and in the public square that go well beyond what the empirical evidence will support, whether it is microaggressions or any of the other topics that social scientists study. The public knows this.30 And if we do not find a way to address it, we will no longer be able to do the work that we care so deeply about. If we don’t have credibility, we are going to be increasingly sidelined. It won’t matter who we want to help. Recommitting ourselves to rigor and intellectual humility is in the best interest of our discipline.
Sociology needs more construct validity, more rigorous methods, and higher standards for what counts as empirical evidence. We need more adversarial collaboration, more severe testing, and more red-teaming. We need more serious consideration of alternative hypotheses, more good-faith steelmanning, and more engagement with contradictory findings from other disciplines.31
We need fewer studies that begin with conclusions already in hand, and we need to be better at explicitly differentiating exploratory from confirmatory analyses. We need less causal overreach, less overclaiming of results, and fewer policy recommendations our findings cannot support.32 We need less idea laundering33 and less concept creep. And we need far less of the activist posture.
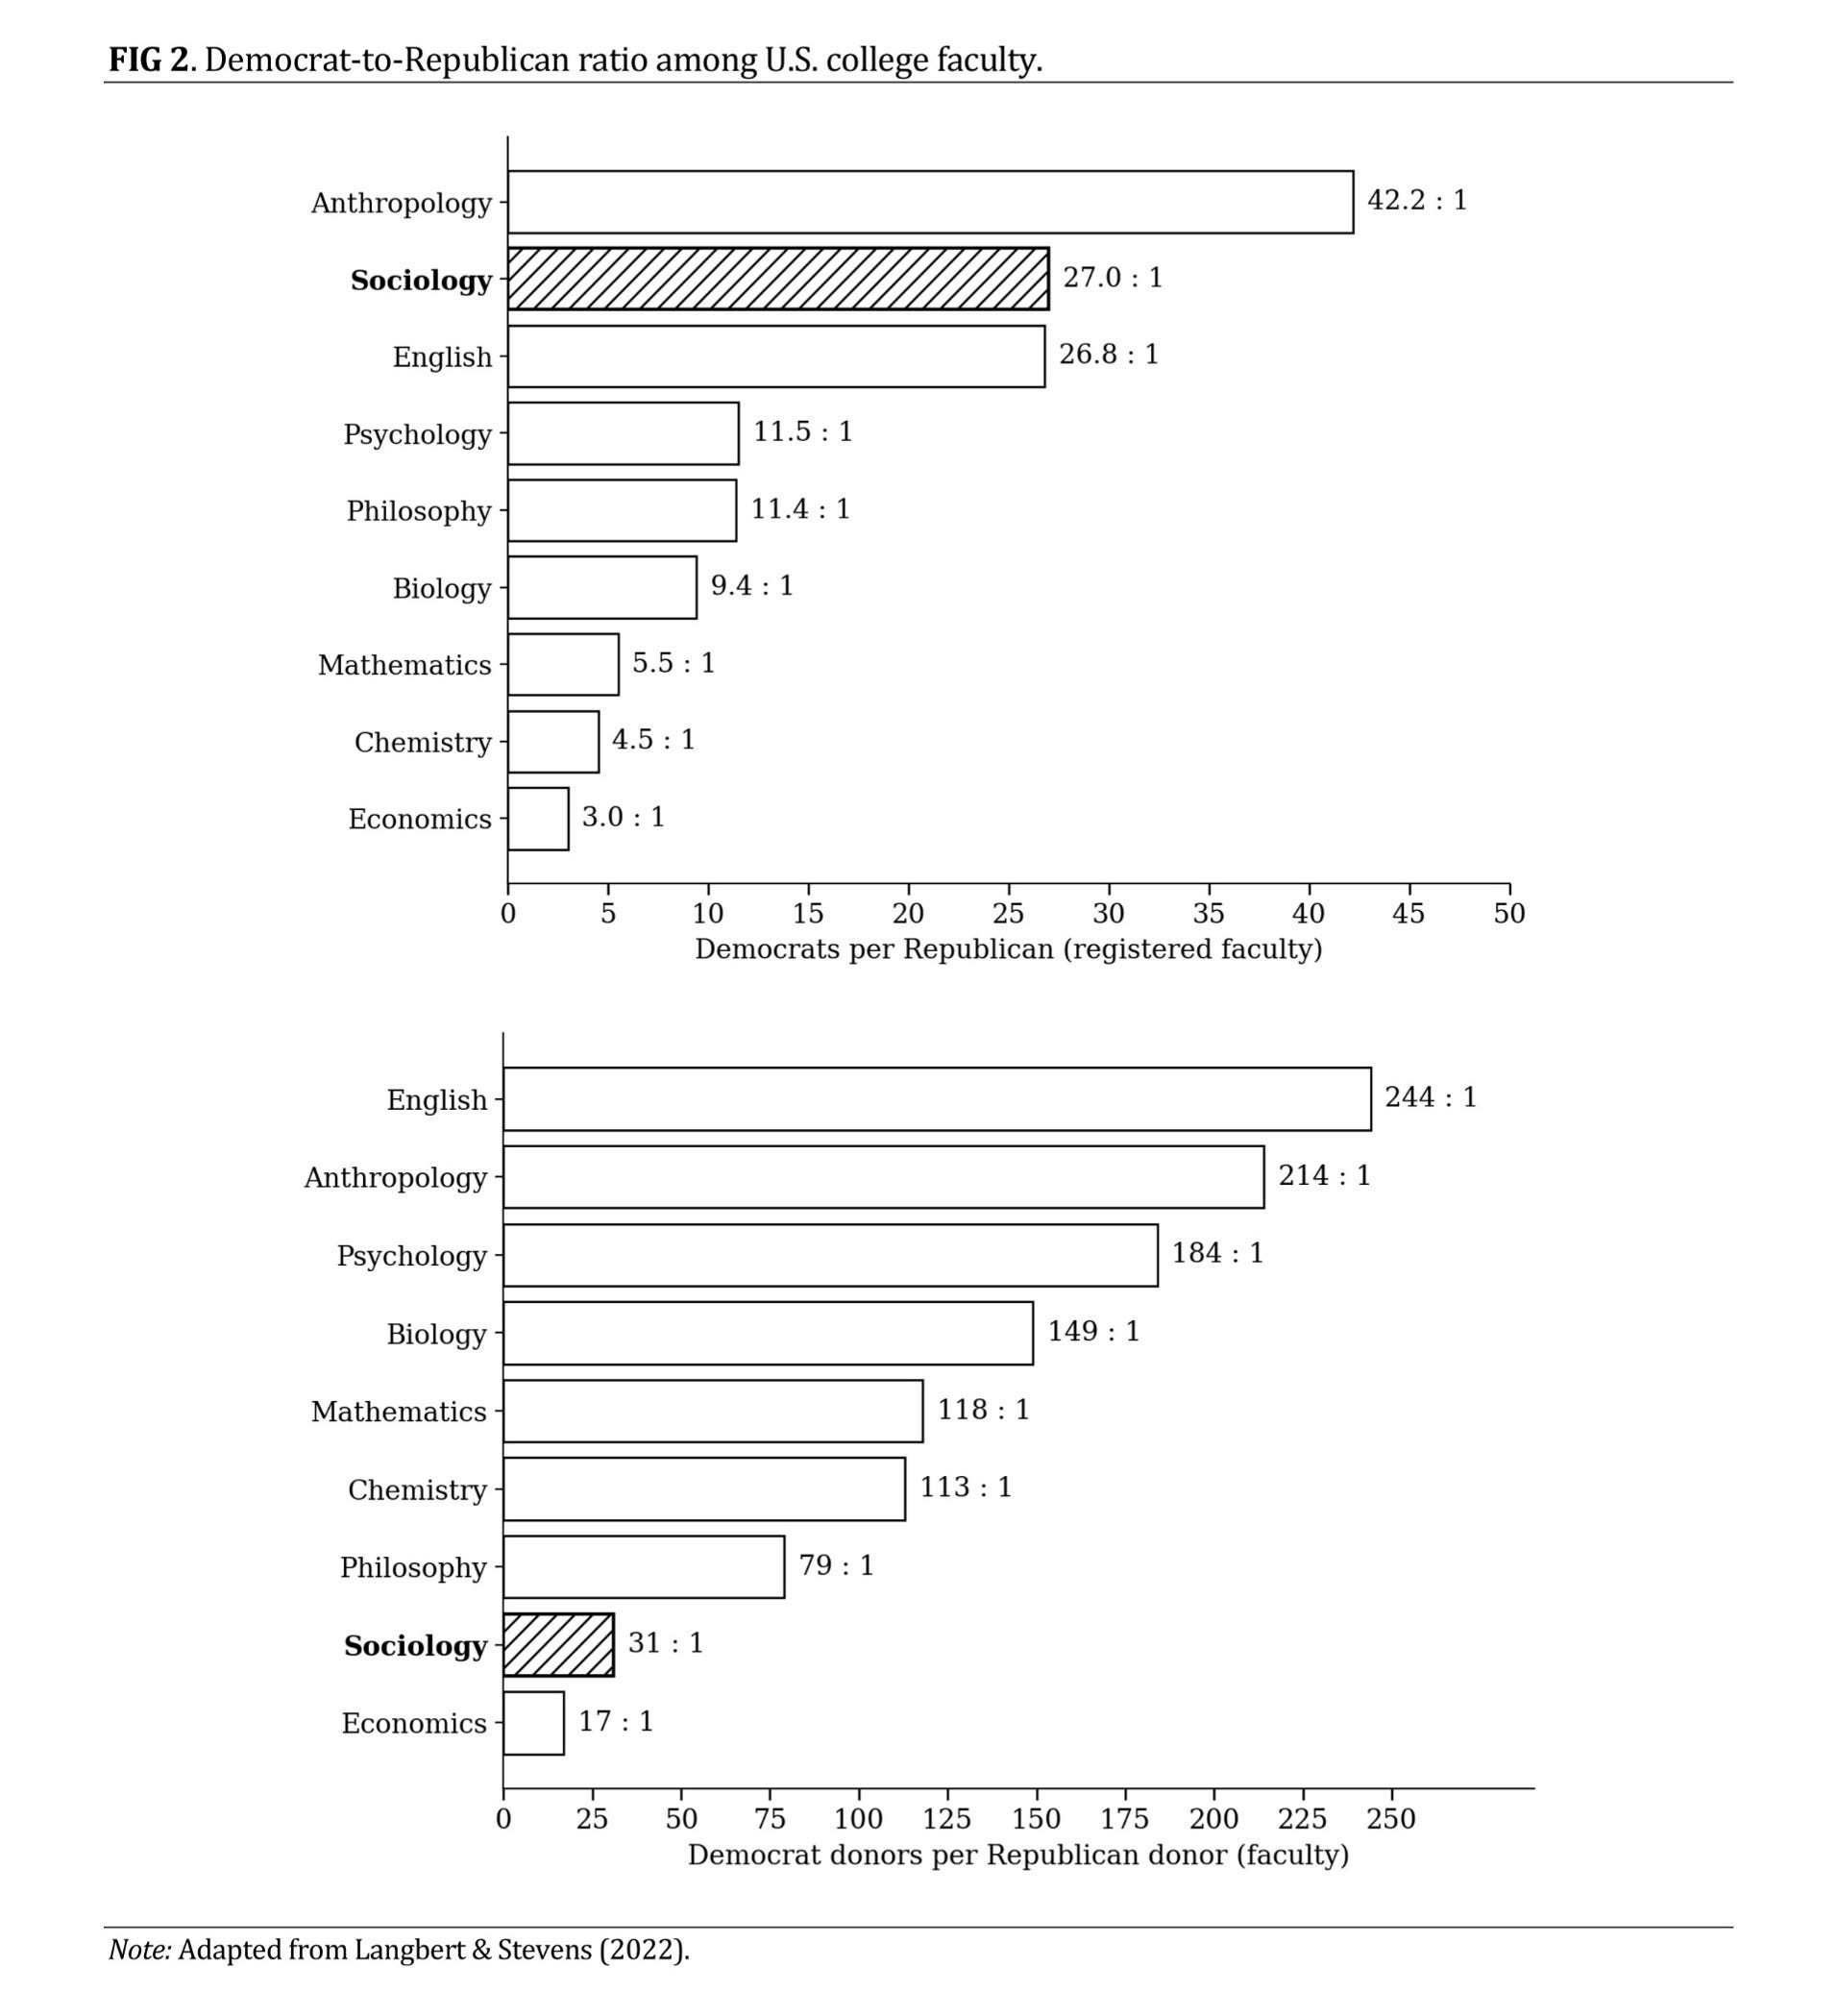
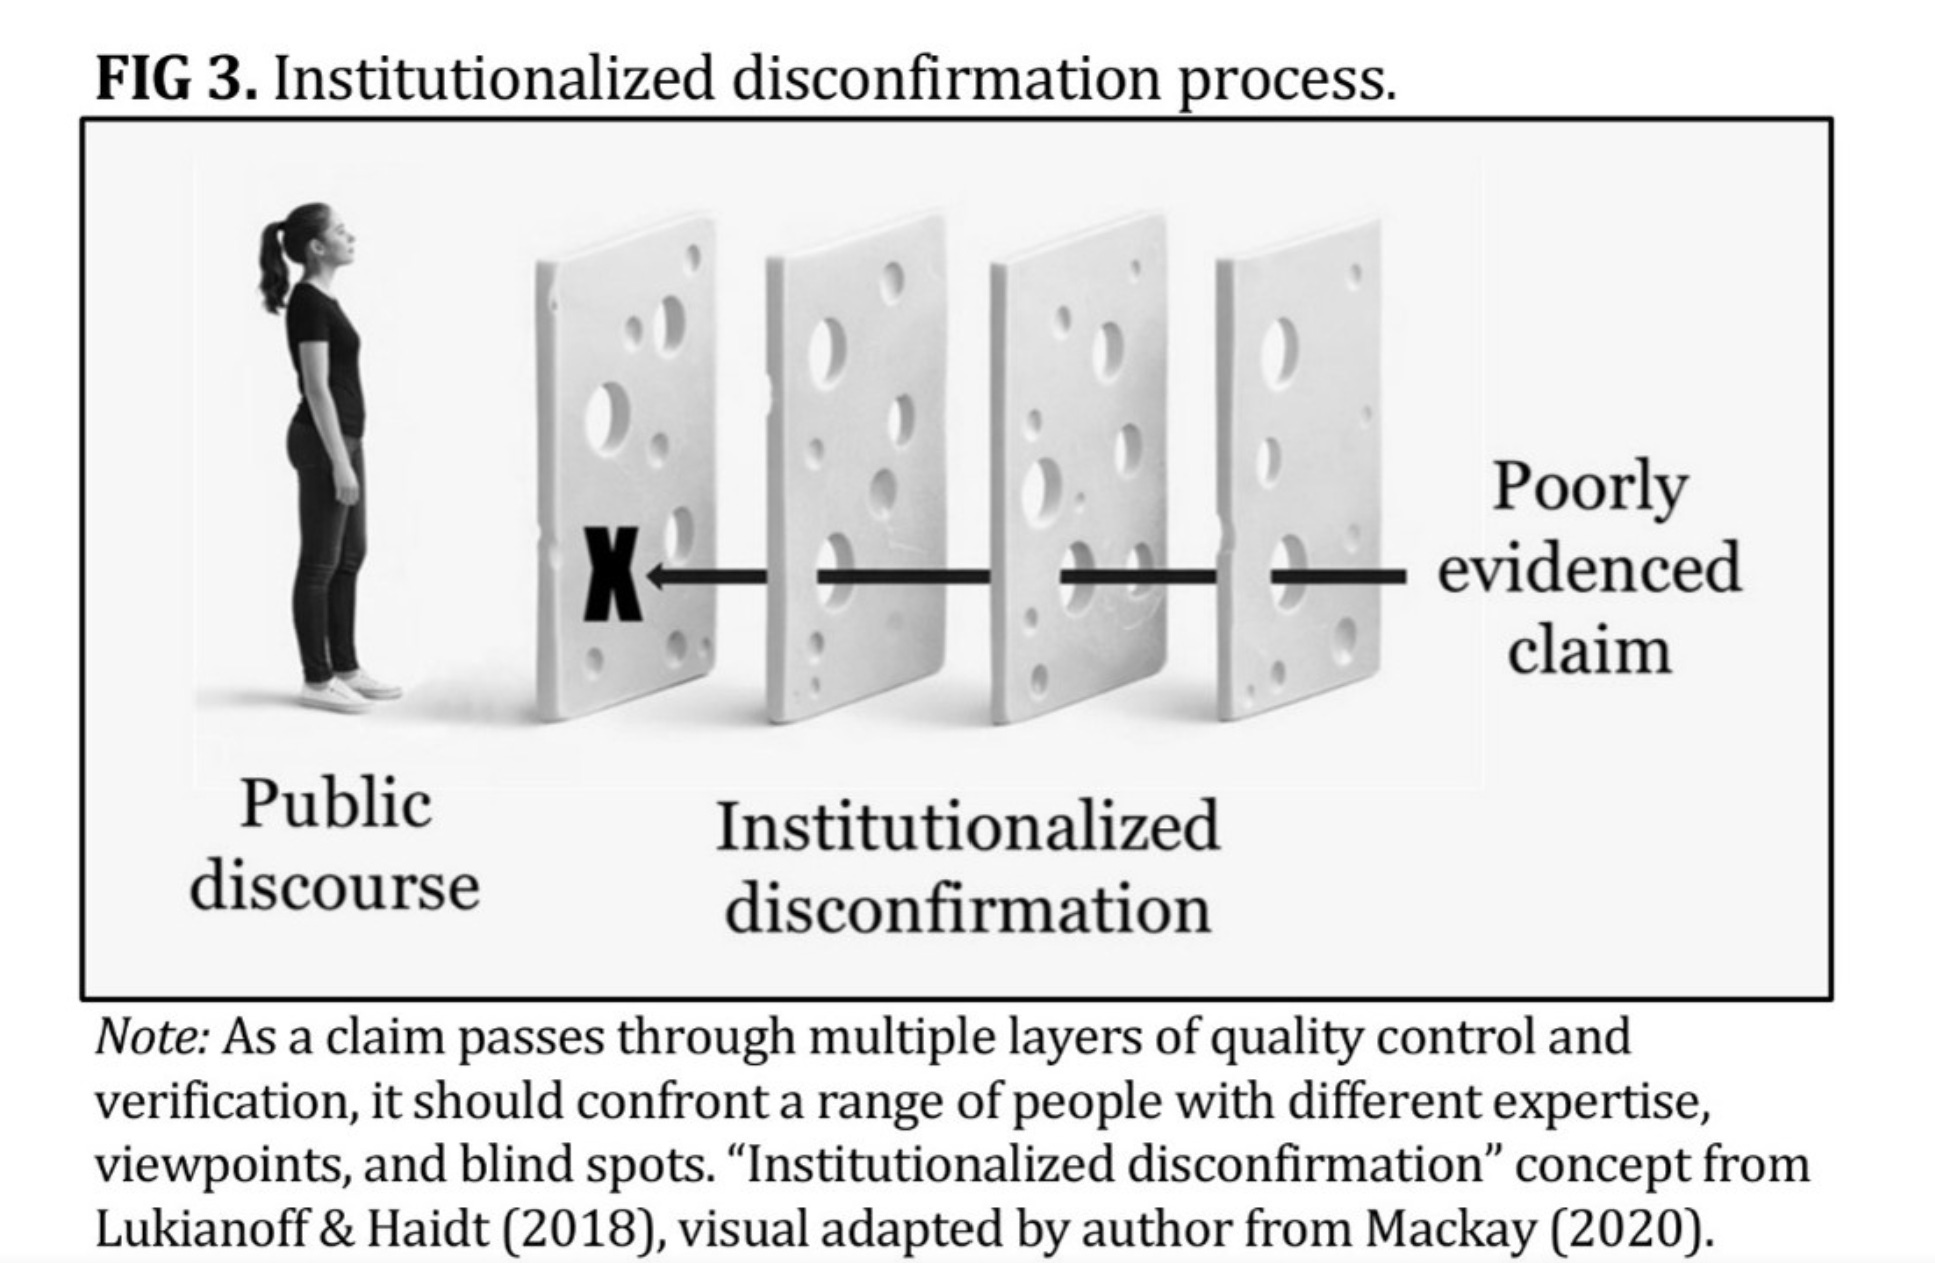
Peer review needs reform in both quality and transparency. We desperately need a wider variety of viewpoints in our field (see Figure 2 above) so that institutionalized disconfirmation works as designed (see Figure 3 above).34 We need that same viewpoint diversity in hiring, promotion, and grant decisions. We need our field to institutionalize more high-quality meta-analyses in core research areas, alongside systematic replication attempts of major findings.35 And we need more transparency throughout: publicly available data and code, and maybe even publicly available peer review reports—not only for published articles, but also for the manuscripts that journals choose not to publish.36
We need more topics opened to honest debate. We need more carefully operationalized concepts, more claims framed in ways that can be refuted, and more stated falsification conditions. We need more honesty about the samples we’re generalizing from and more open acknowledgment of what our findings cannot support. And we need more findings that actually replicate.
We can do a much better job training sociologists in graduate school, particularly in quantitative methods, causal inference, the full scope of relevant debates, and intellectual humility. And in the classroom, we need more honest presentation of where the weight of the evidence actually lies—this includes better textbooks, which often have a significant amount of misleading information. As Jukka Savolainen points out:
“As Christian Smith argued in The Sacred Project of American Sociology, the field has become less about scientific discovery and more about advancing progressive moral aims. Undergraduate sociology textbooks often function less as neutral teaching tools than as ‘re-socialization manuals’ for political activism.”37
In sociology and the social sciences more broadly, claims often face less scrutiny the more they comport with our ideological priors. And these claims do not distribute randomly across the ideological spectrum. They lean. Consistently, and in one direction. If you have spent time in this discipline, you already know which direction I mean—to the left.
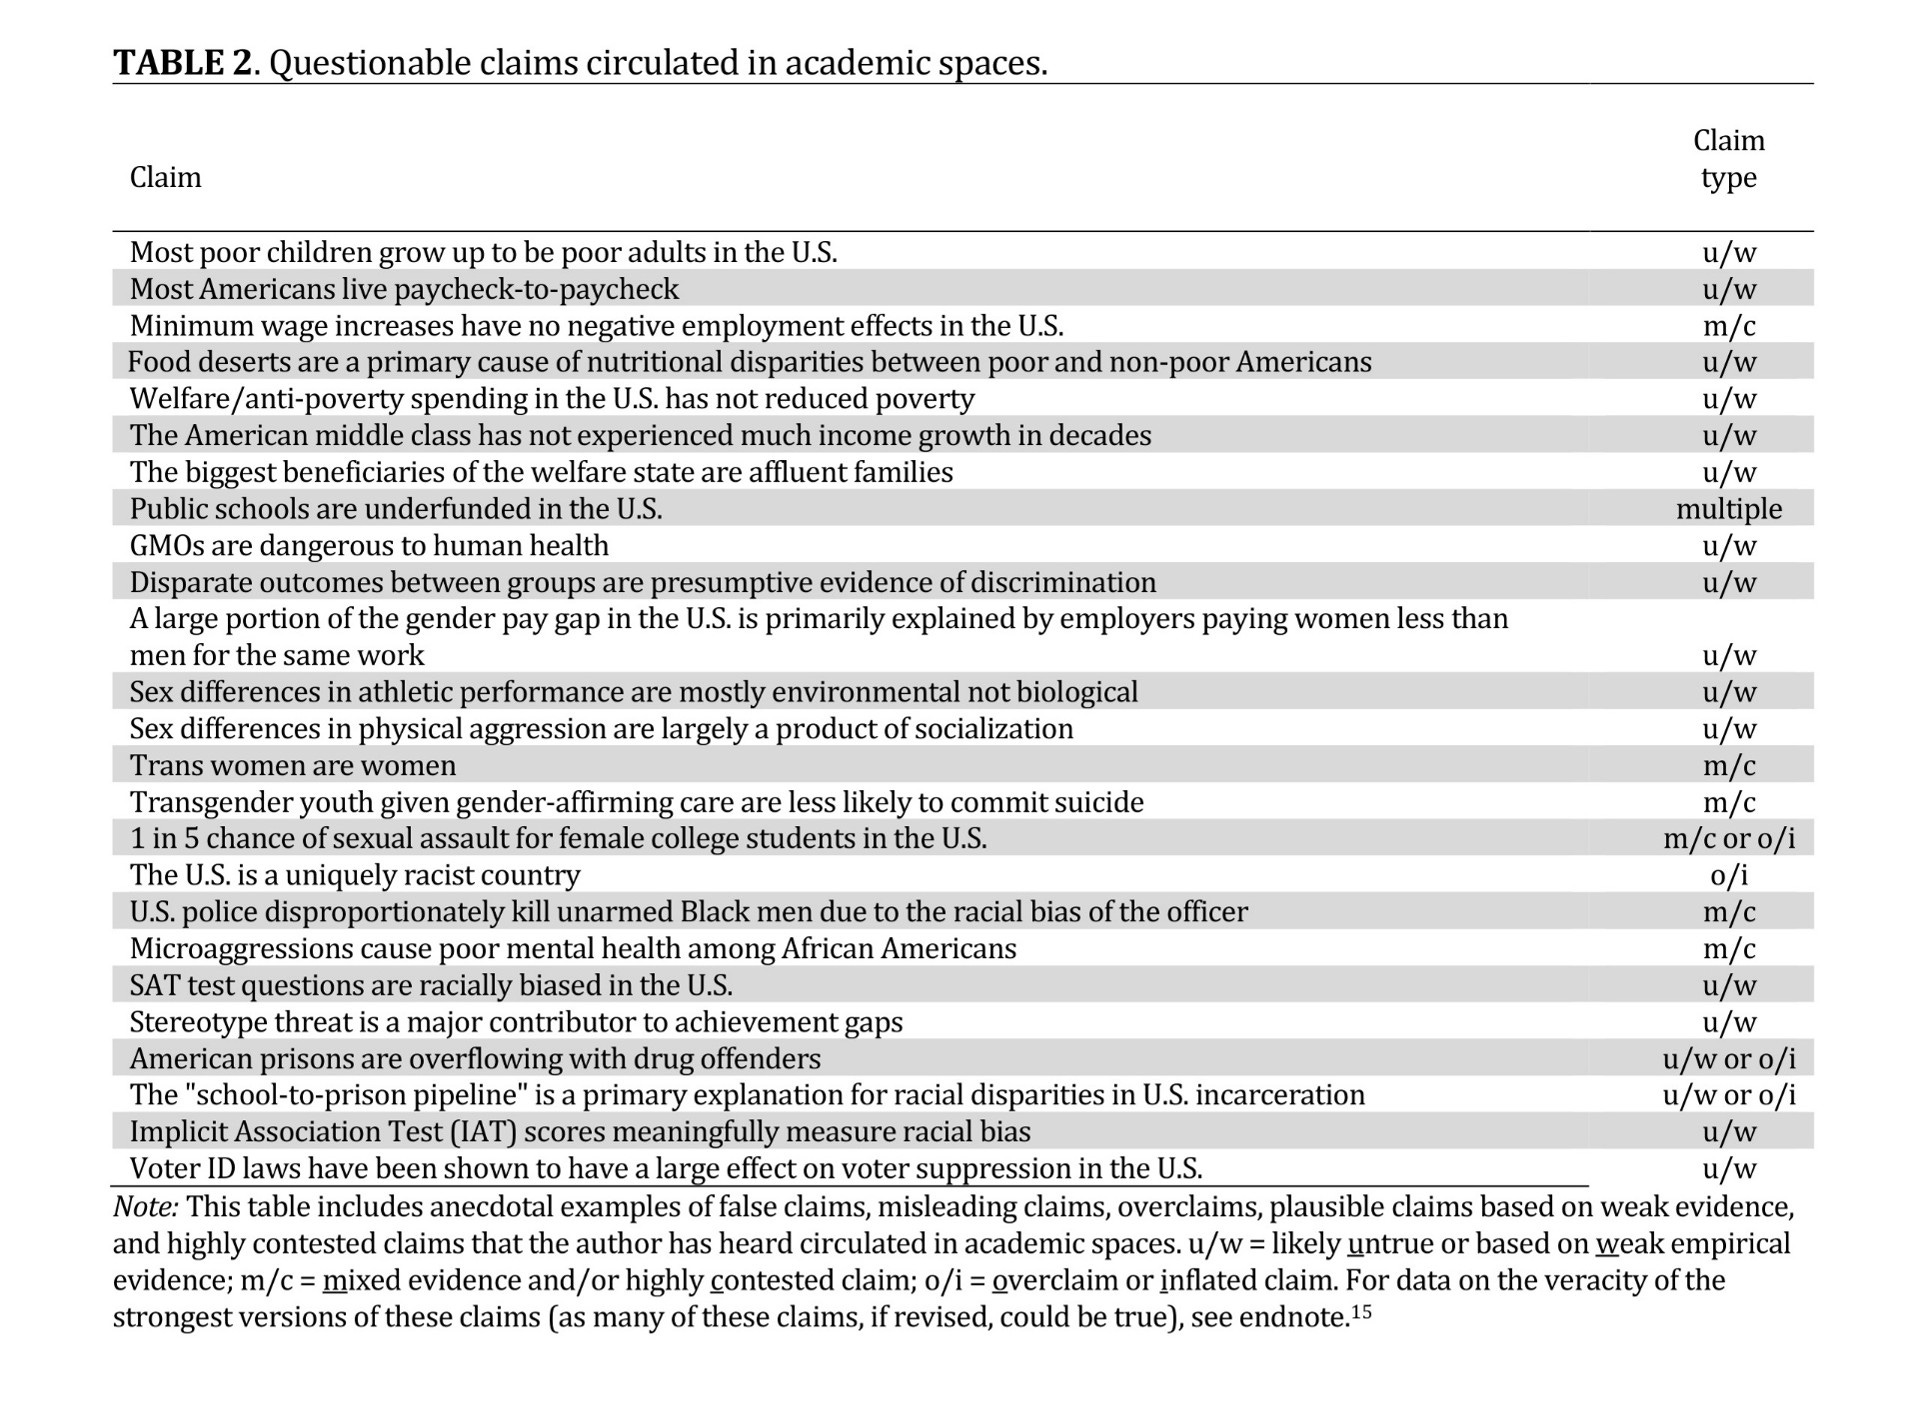
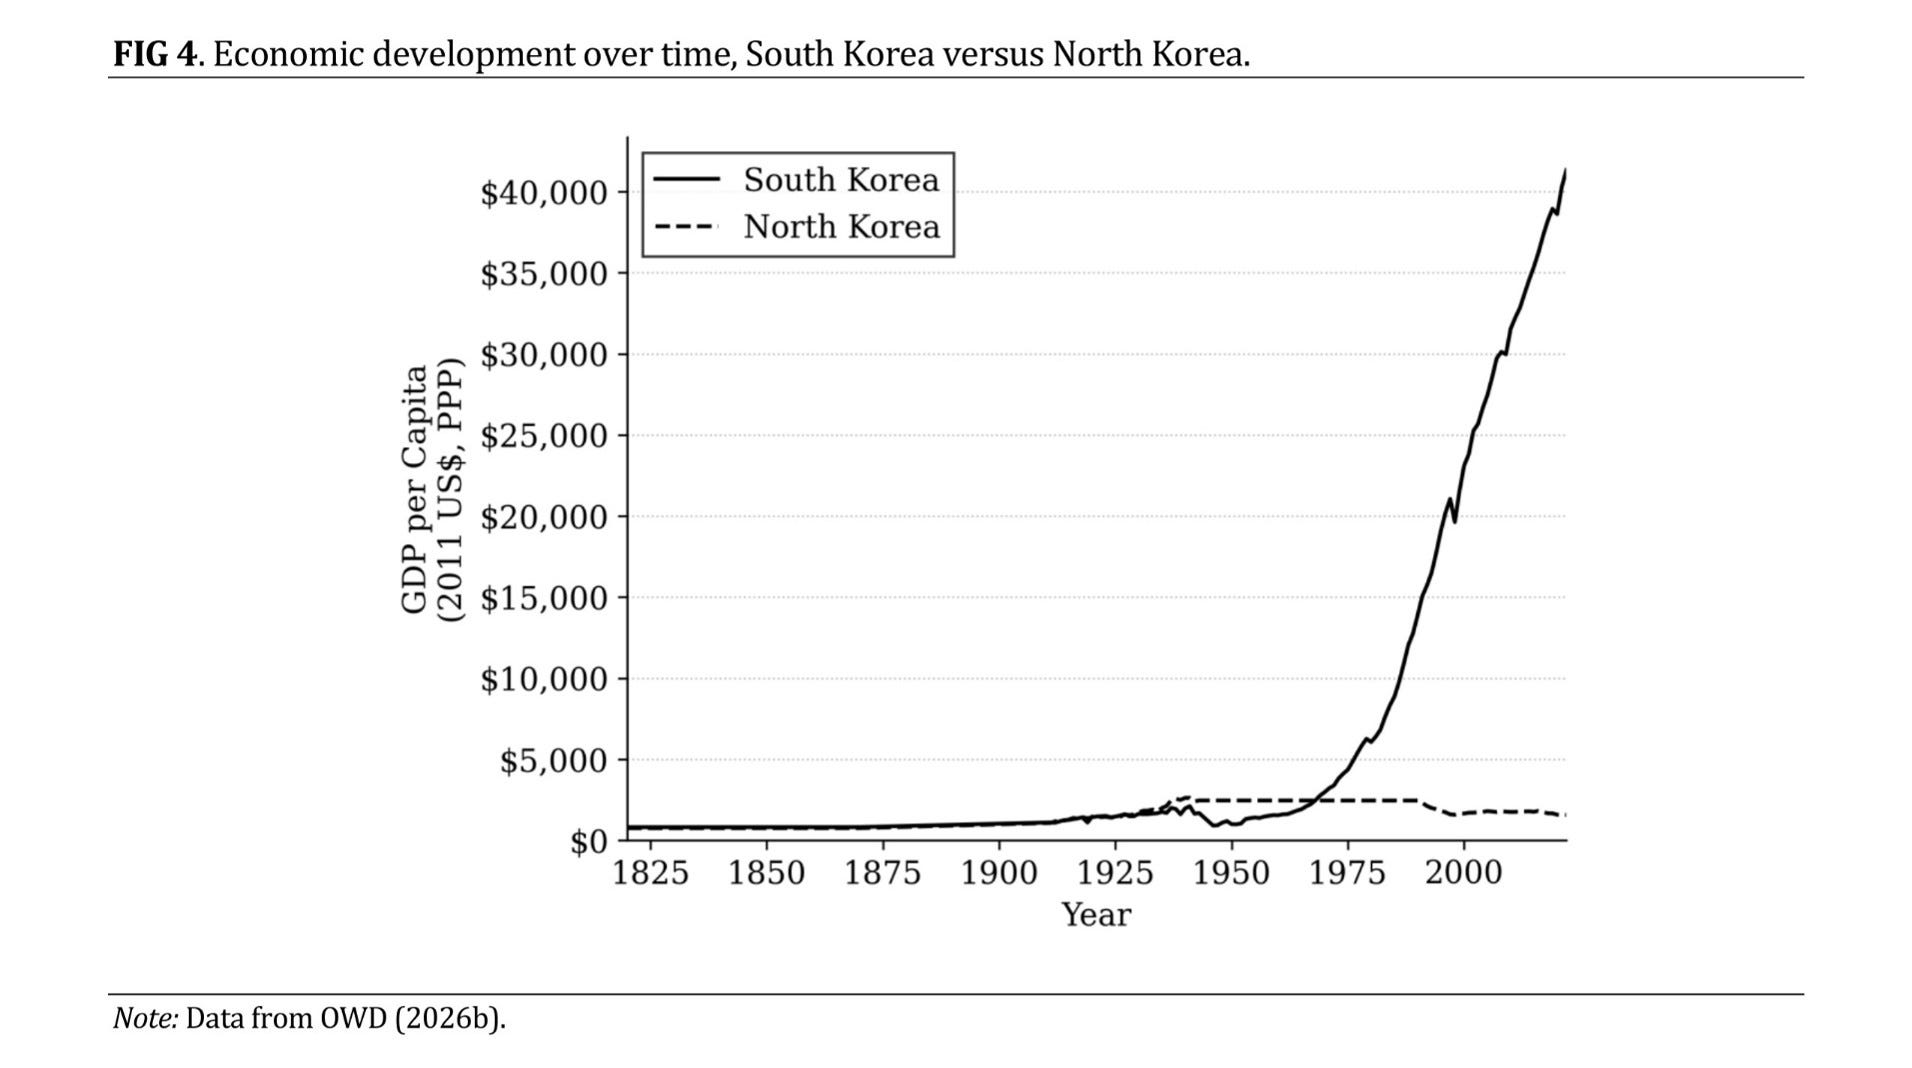
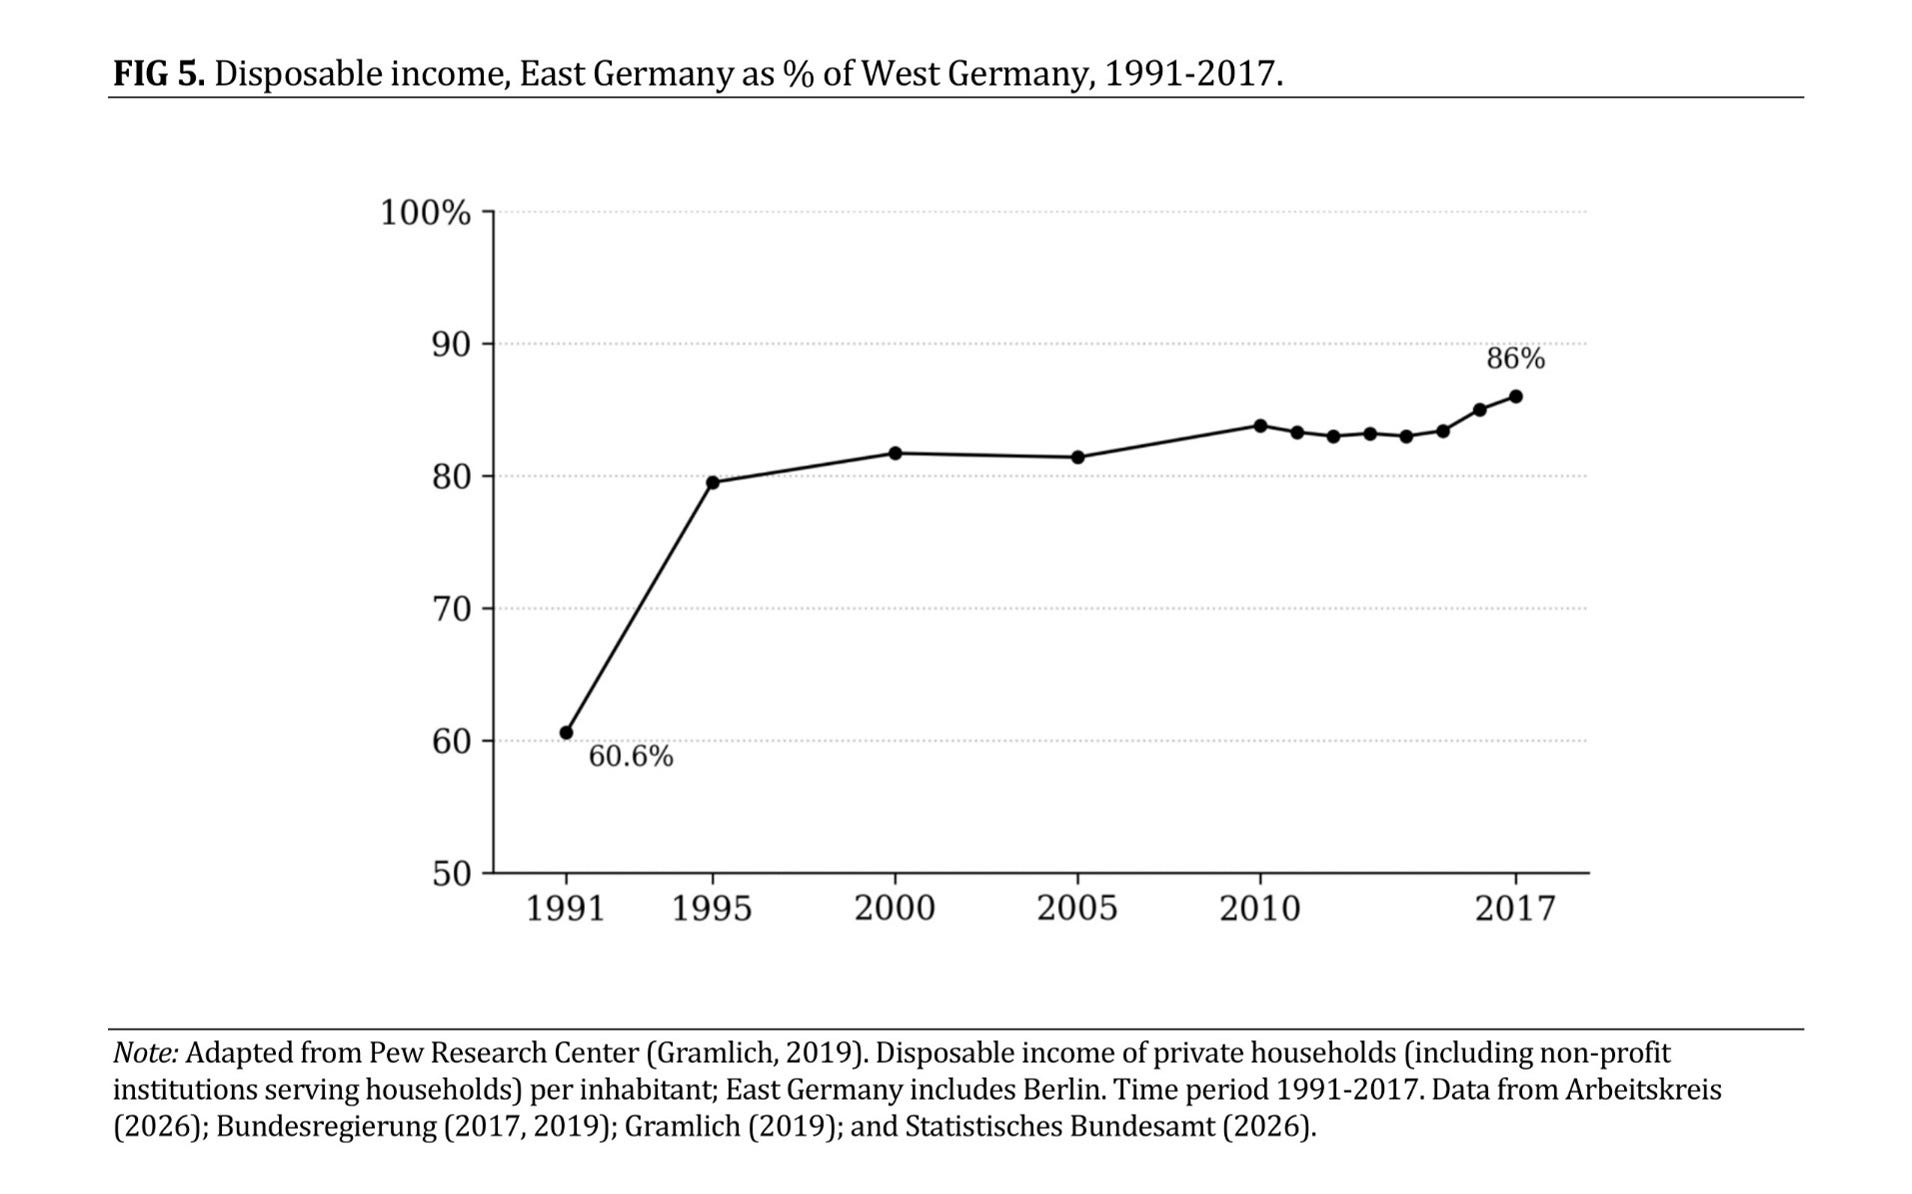
There are overclaims, where academics make claims grounded in evidence but that go well beyond what that evidence will support—such as “Microaggressions cause poor mental health among African Americans.”38 There are highly contested claims presented as fact, like “Trans women are women.”39 There are cherry-picked claims—like those that fixate on capitalism’s evils and give short shrift to its virtues (see Figures 4 & 5 below). There are claims that are based on weak evidence but circulate widely because they are plausible and ideologically convenient—like those around implicit bias.40 And there are false claims—for example, “Most poor American children will grow up to be poor adults,” which is almost certainly not true.41
This collection of claims (see Table 2 below for more)42 is not a work of empiricism—these are anecdotal examples of claims of a certain type that I’ve heard repeatedly in academic settings. Again, they aren’t always entirely false; often they simply go well beyond what the best available evidence will support.
Claims without sufficient evidence aren’t science just because they come from scientists. When we go beyond what the data will bear—in our research, our classrooms, our public commentary—we aren’t doing science. We’re doing activism with a scientific veneer. As Lee McIntyre argues:
“It is unfortunately true that a good deal of social science today is unreliable, due to its infection by political ideology. Even in universities, in some fields there is no clear line between ‘research’ and political advocacy.”43
I think he is right.
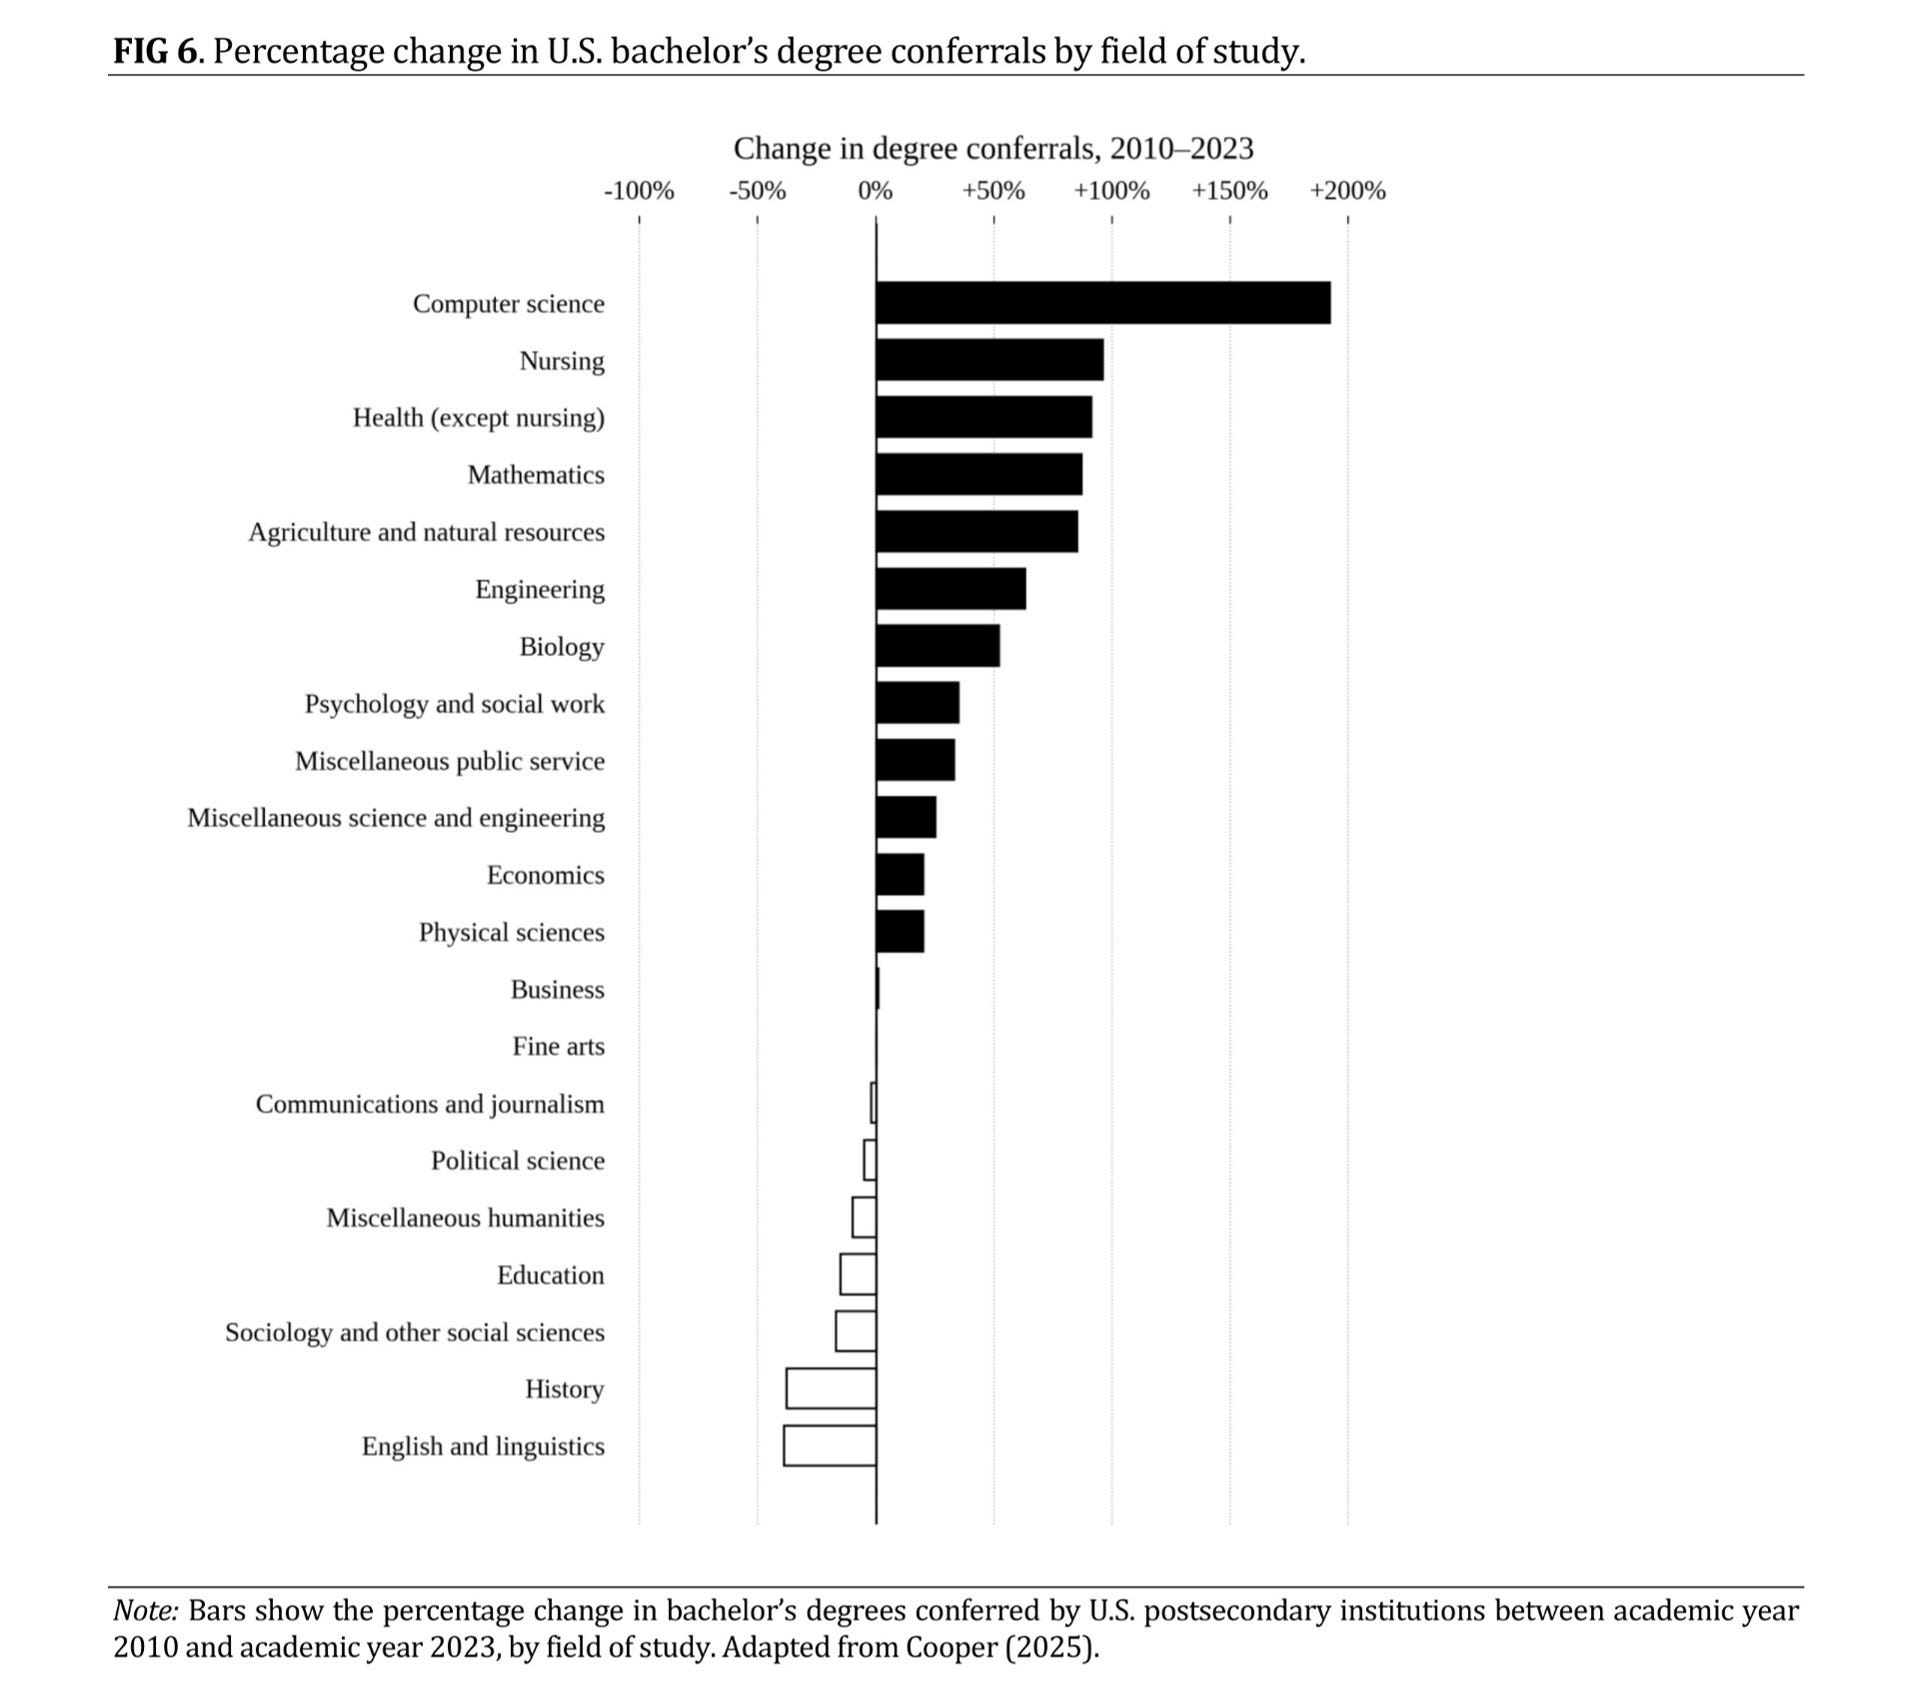
I want to focus on these epistemological failings in this article, but I recognize this isn’t the only nor is it even the most pressing problem facing our discipline. The broader enrollment picture, for instance, is not encouraging, and a lack of majors is the thing that directly threatens many sociologists (see Figure 6 below). Students seem to be making increasingly instrumental choices—gravitating toward fields with clearer perceived employment pipelines and higher earnings trajectories. Polls show that many students do find sociology interesting, but they nonetheless are not very enthused about becoming majors.44
But while enrollment may be a primary concern for many sociologists, these epistemological failings I have mentioned are not unrelated. I believe that part of righting the ship in sociology is improving our credibility. My biggest concern as a researcher is getting as close to the truth as possible, and I don’t always believe that we are doing that as a discipline. Recommitting ourselves to rigor and intellectual humility, in my mind, will have positive spillover impacts in other areas of concern for our field.
Now, I want to be careful here, because the “sociology is in crisis” narrative is itself something of a sociological tradition at this point—there’s always someone ringing the alarm bell. For instance, Pitirim Sorokin’s Fads and Foibles in Modern Sociology and Related Sciences was published in 1956, and the genre arguably runs older still. Nobody wants to be Chicken Little.

With that said, I do think we are at an inflection point. I don’t know whether there’s a threshold past which recovery becomes impossible—or, if there is, when we will cross it. But I sincerely fear we may be entering a downward spiral we won’t be able to pull ourselves out of.
I know that many sociologists will have a negative visceral reaction to what I am arguing. That reaction is understandable. We are living through a moment when bad faith political actors are targeting our discipline. And when the attacks are in bad faith, the instinct to close ranks is not unreasonable.45
But I want to suggest that we hold three things in mind simultaneously. First: many of these actors are not engaged in honest intellectual inquiry. This is true. They are carrying out a political project, and we should name it as such.
Second: that does not mean every argument they make is wrong. Some of their criticisms have real merit. Others are misleading. Still others are simply nonsense. Separating those categories is our job, and refusing to do so because we dislike the source is itself an intellectual failure (that old pesky genetic fallacy).
Third, and most importantly: entirely independent of these attacks—as if they did not exist at all—we have real, foundational problems in our discipline. Problems that we have not adequately reckoned with. Problems that, if left unaddressed, will continue to erode the credibility we need to do the work we believe in.
Some of the problems bad faith actors are pointing at—however clumsily and however cynically—were problems that were already there. Their true character may differ from how sociology’s opponents describe them, and their solutions may also differ from what our discipline’s detractors desire.46 They are nonetheless problems that must be solved.
Mugged by the Data
According to Gallup, Americans’ trust in higher education generally has been going in the wrong direction. A little over a decade ago, 57% of Americans expressed a high level of trust in higher education, a number that has fallen to just 42% today. For those with little trust in higher education, perceived “political agendas” and “wrong focus/don’t teach the right things” regularly top the list of objections.47
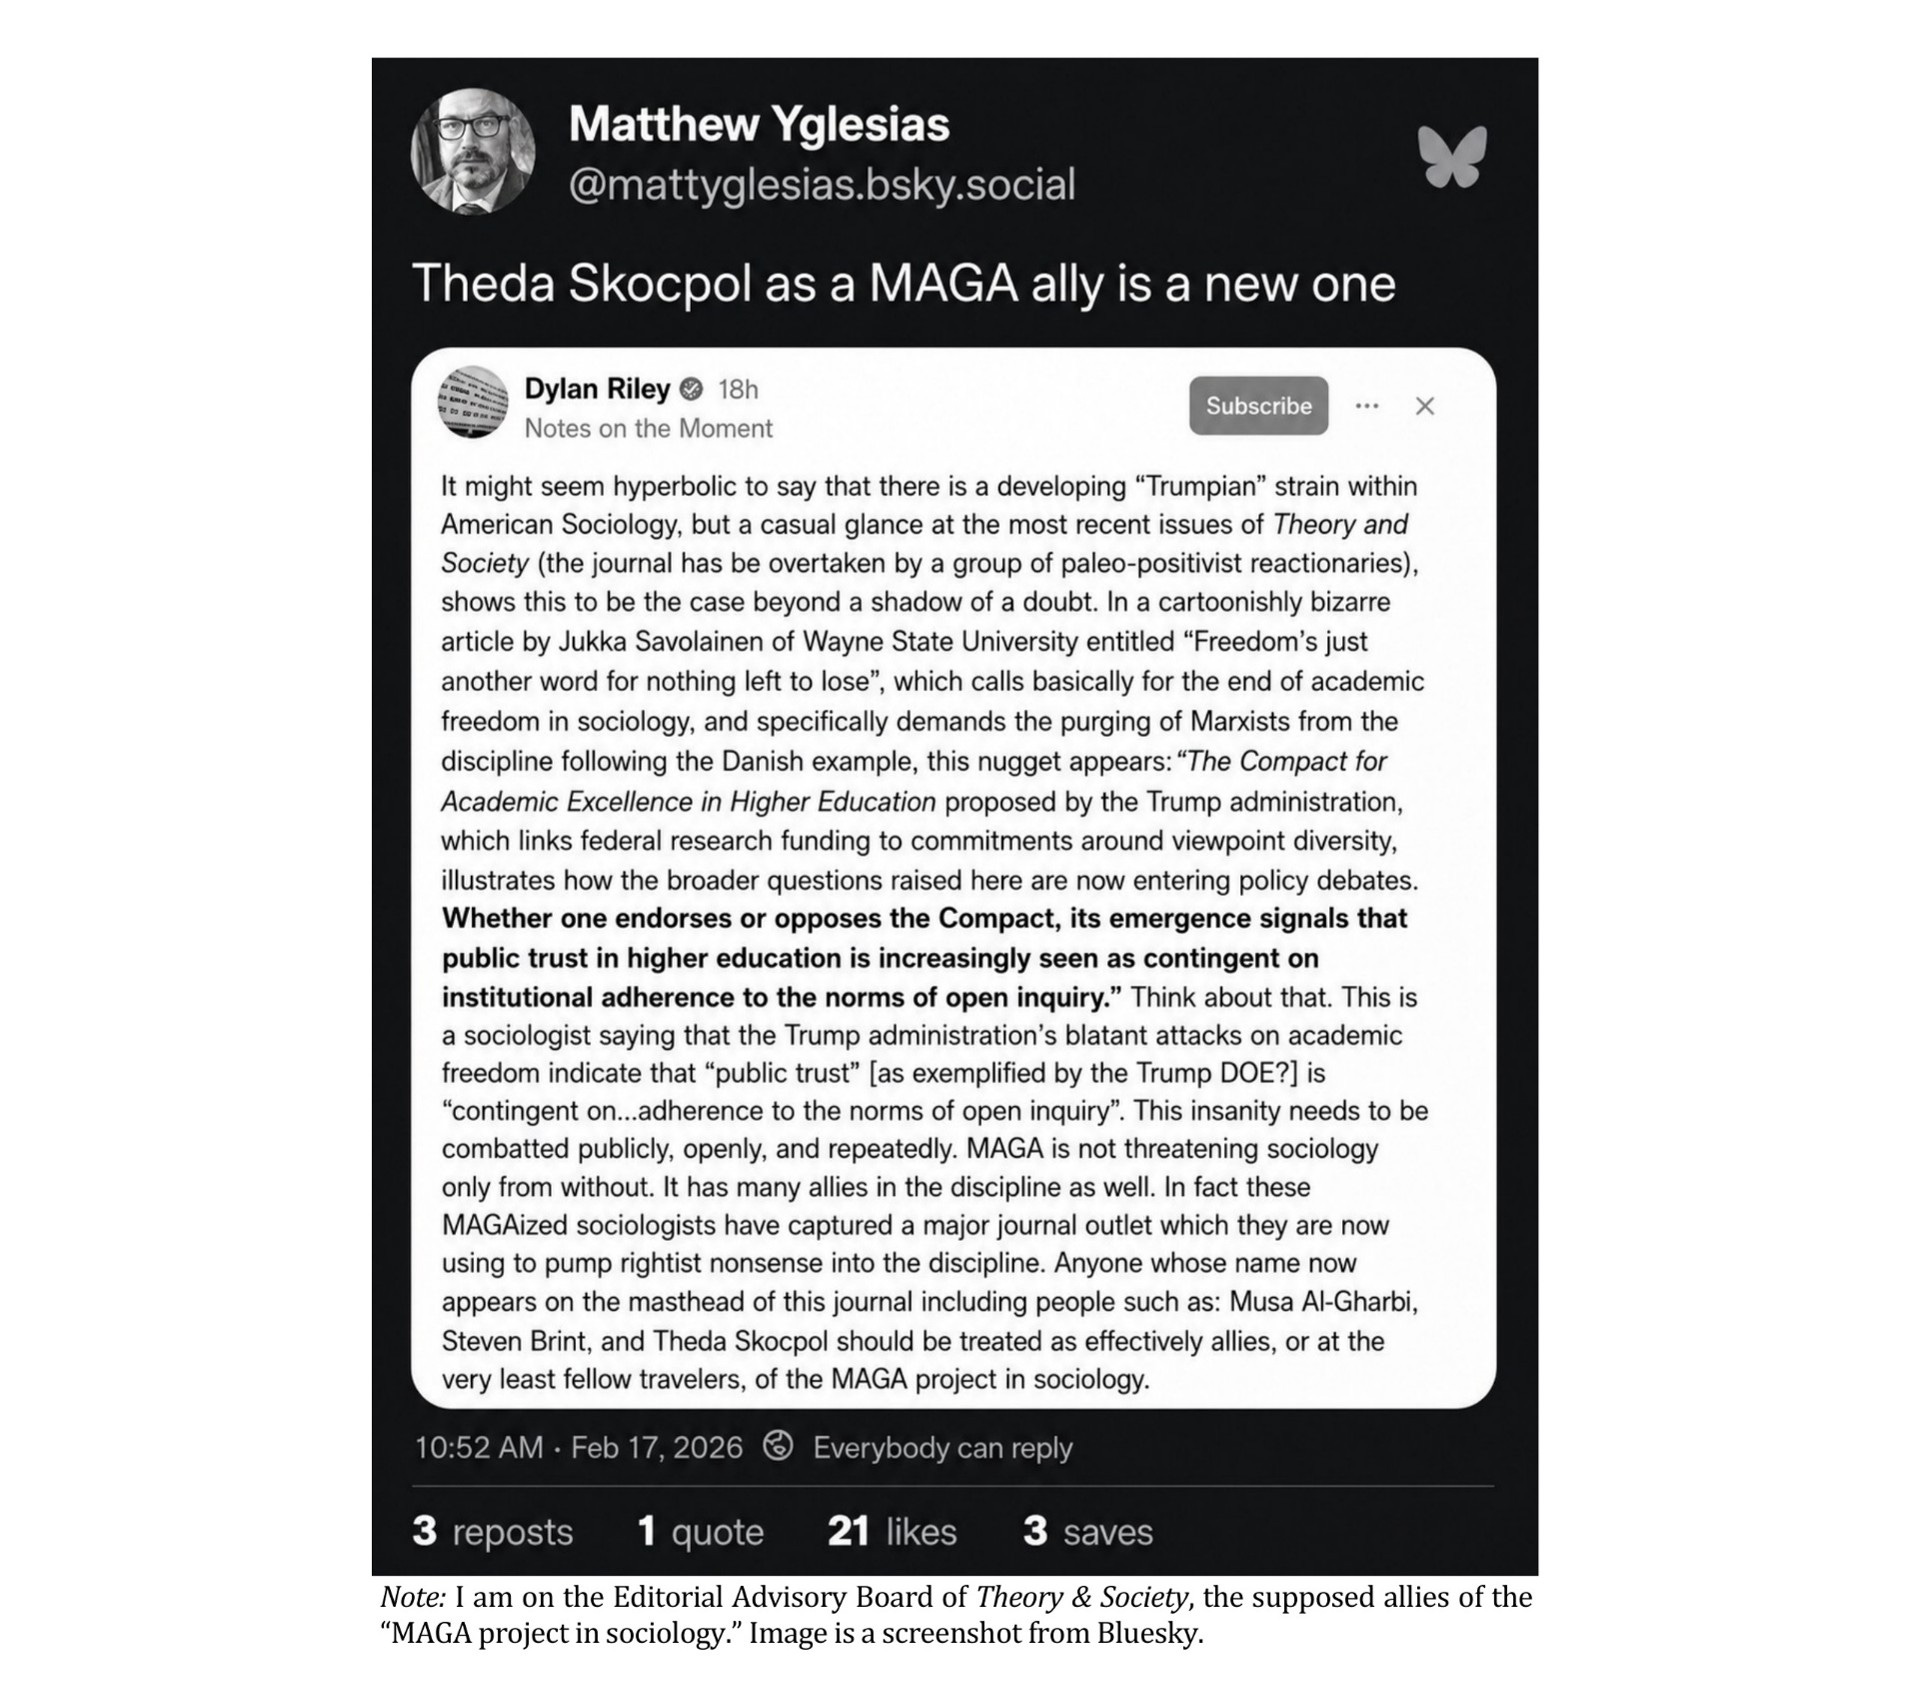
I believe there is a lot of merit to these concerns, and not because I am MAGA—I am emphatically not, despite what some may claim (see image below).
I cast my first presidential vote in 2000, the year I graduated from high school, for Al Gore. I followed that with votes for John Kerry, Barack Obama twice, Hillary Clinton, Joe Biden, and Kamala Harris. I vividly recall the look of horror on my wife’s face when I woke her up late one night in 2016 to inform her that Hillary Clinton had lost to Donald Trump, something I assured her and myself couldn’t possibly happen.
I graduated with my Ph.D. believing that as a sociologist I was always “following the science,” and that my political tribe, the Democrats, was the party of science—a seemingly perfect alignment.
The earliest that I remember sensing a problem in academia was with the publication of Michelle Alexander’s The New Jim Crow. It seemed like all the sociologists in my social and professional circles were talking about it and assigning it in their courses. I read it as well and found it very compelling. Whether this was Alexander’s intention or not, she had convinced me and many of my colleagues and students that our prisons were filled with low-level drug offenders and this belief fueled a lot of the radical reform and abolitionist sentiment on campus.
Alexander’s book struck me as essential, and I intended to teach it that way. Take, for example. this excerpt from the book’s Introduction, which floored me when I read it:
“The impact of the drug war has been astounding. In less than thirty years, the U.S. penal population exploded from around 300,000 to more than 2 million, with drug convictions accounting for the majority of the increase. The U.S. now has the highest rate of incarceration in the world. . .”48
By the time I got around to discussing her work in my own classroom, Alexander’s statistics were a bit dated. So I decided to go ahead and update them in my lectures. When I downloaded the state and federal prison data, however, it didn’t tell the same story. The drug war was a part of the rise in incarceration, but it was hardly the only factor. Even if you released all those convicted of any drug offense from federal, state, and local prisons and jails, regardless of how big or small their offense, the U.S. was still at or very near the top in international incarceration comparisons49—yet Alexander claimed that our outsized incarceration rate is “a development directly traceable to the drug war.”50
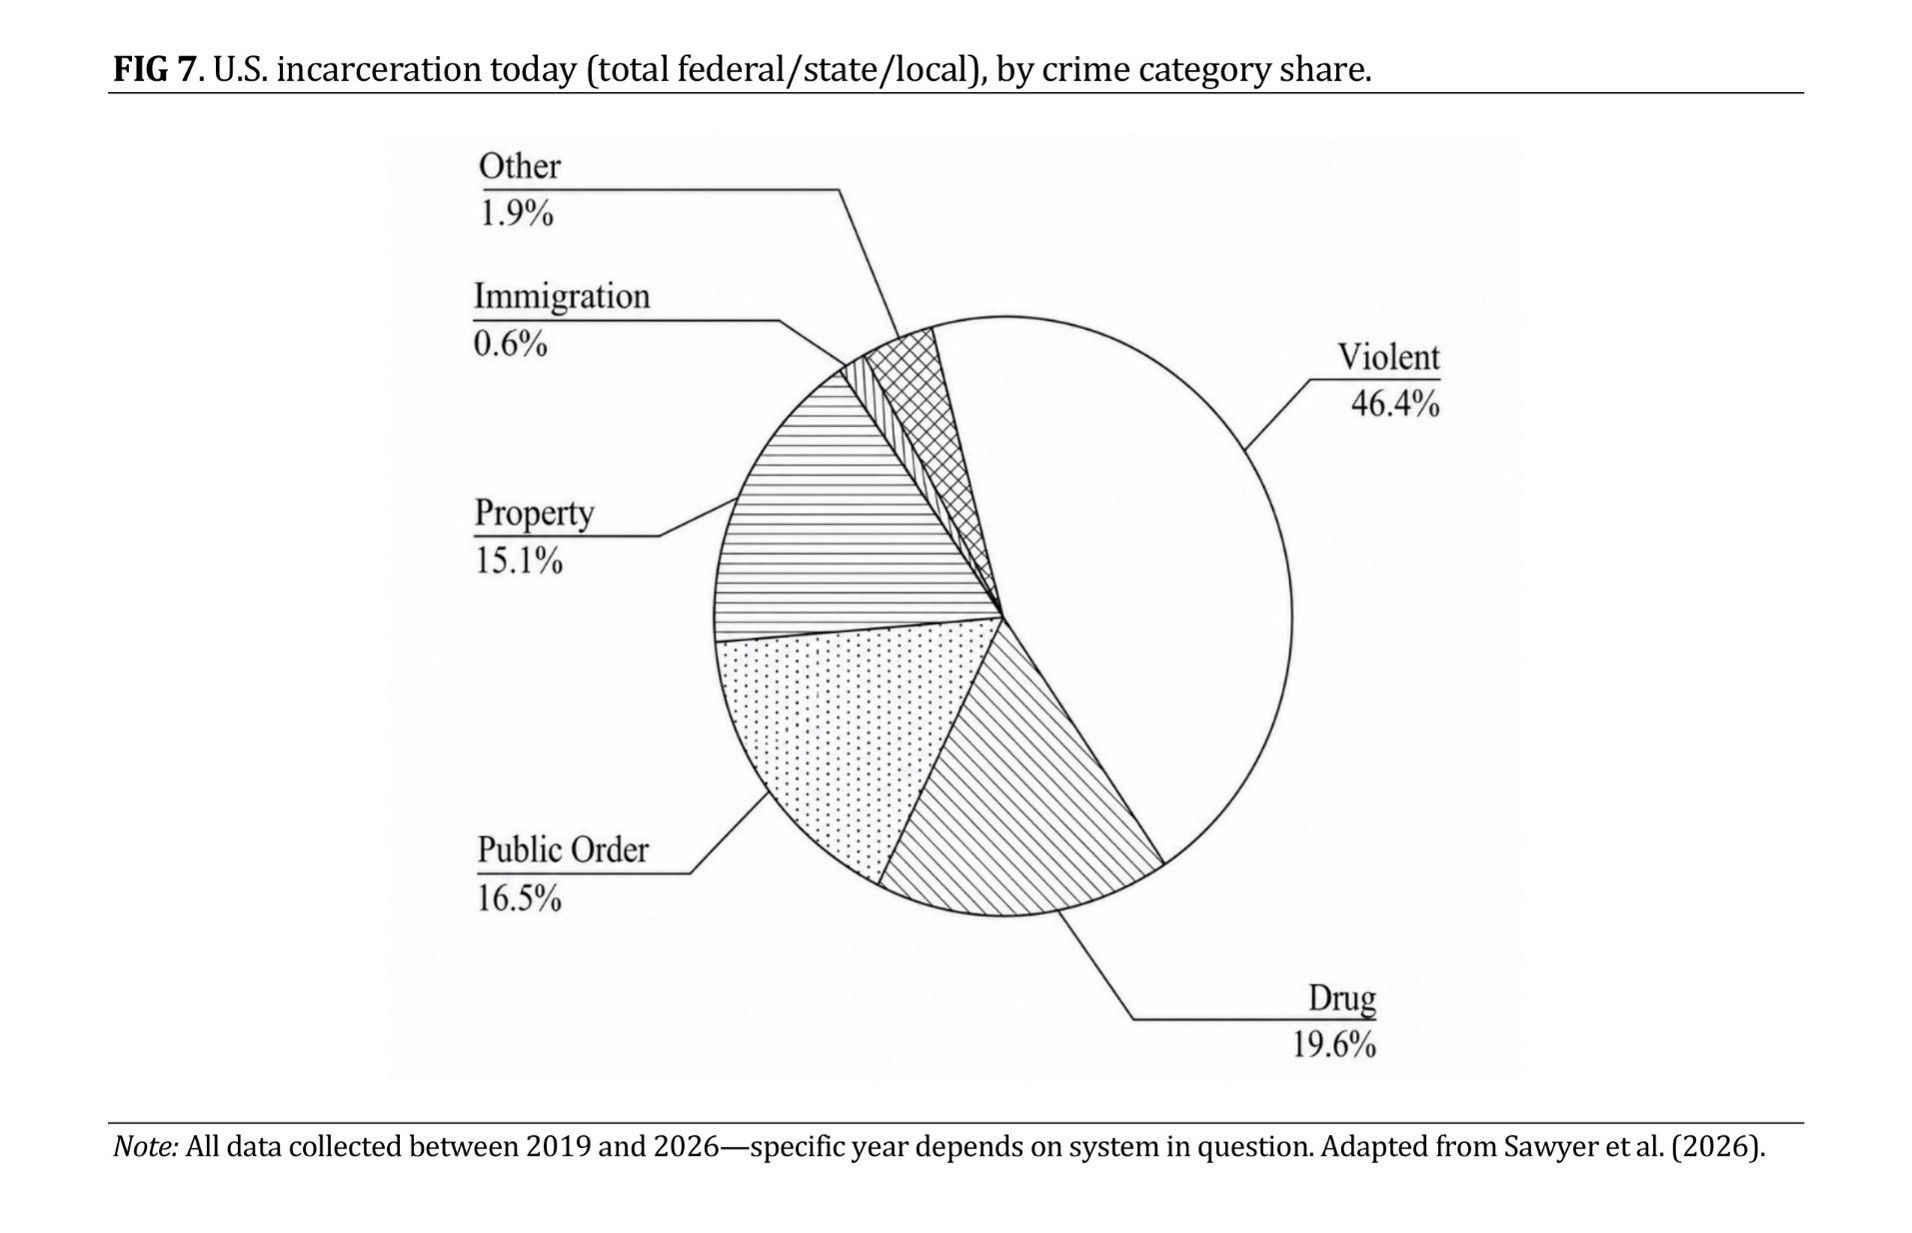
In 2010, the year The New Jim Crow was published, only around 22% of the state and federal prison population was incarcerated for drugs,51 despite Alexander claiming that our prisons were “overflowing with black and brown drug offenders.”52 By my calculations (see Figure 7 below), that number is around 20% today,53 and the vast majority of drug offenders are not in prison for possession but for something more serious like trafficking.54
Alexander’s claims were more careful in many instances, it is true—but then much less so in others. In some of her writing and public statements she referred to arrests. In others, she referred to those with criminal convictions—a population that includes those in prison or jail, but also those on probation or parole. Other times she talked about the growth in the prison population, not the total current prison population. And other times she suggested she was talking about the total prison population, giving the strong impression that drug offenders fill our prisons.55 Her core arguments rested on definitions that matter a great deal, and she—as well as those who cited her work—was often sloppy with how she slipped from one definition to another.56
The way Alexander’s ideas were laundered through many college syllabi, lectures, and campus talks, as well as public statements by academics, had many students believing prisons were currently filled with nonviolent drug offenders, which is and has always been false. As James Forman Jr. wrote in his well-known critique of The New Jim Crow:
“[E]ven if every single one of [the currently incarcerated] drug offenders were released tomorrow, the United States would still have the world’s largest prison system. Moreover, our prison system has grown so large in part because we have changed our sentencing policies for all offenders, not just drug offenders.”57
When I noticed the mismatch between some of Alexander’s claims and the actual prison data when building my classroom lectures, it didn’t make me doubt Alexander. It made me doubt myself. Surely, I had done something wrong—Alexander and many other famous scholars had to know better than me, a newly minted Ph.D. and just-hired assistant professor. And even if I was right, to suggest that Alexander’s arguments were flawed felt like announcing to the world “I’m a bigot.” So I kept quiet, mostly due to my own low self-esteem and assumption that I had surely miscalculated.
At the time, I didn’t suspect that anything was wrong with those studying social issues. But this single data point would soon become a pattern. As the years went on, I started noticing misleading claims in academia with ever-growing frequency. One of the next bumps in the road came in my own area of study, poverty and economic inequality.
I am as guilty as any sociologist of letting my prior beliefs, values, and biases cloud my judgement as a researcher. In fact, I am probably guiltier than many. I published not one but two books with the central empirical claim that that U.S. is an outlier in the wealthy world when it comes to poverty. I don’t think this is true anymore, and I should have questioned this assumption a long time ago.
Sociologists studying poverty often use relative measures when comparing countries. For those unfamiliar, a relative poverty measure typically deems a person to be poor if their household income is less than 50% (or sometimes 60%) of the median national income in their country. The U.S. has a high relative poverty rate compared to most other Organisation for Economic Co-operation and Development (OECD) countries,58 which convinced me as I studied poverty in graduate school that we needed social policies more like Denmark.
Convince is a strong word. It didn’t take much convincing. I had strong democratic-socialist sympathies at the time, so what a coincidence that my work affirmed my worldview!
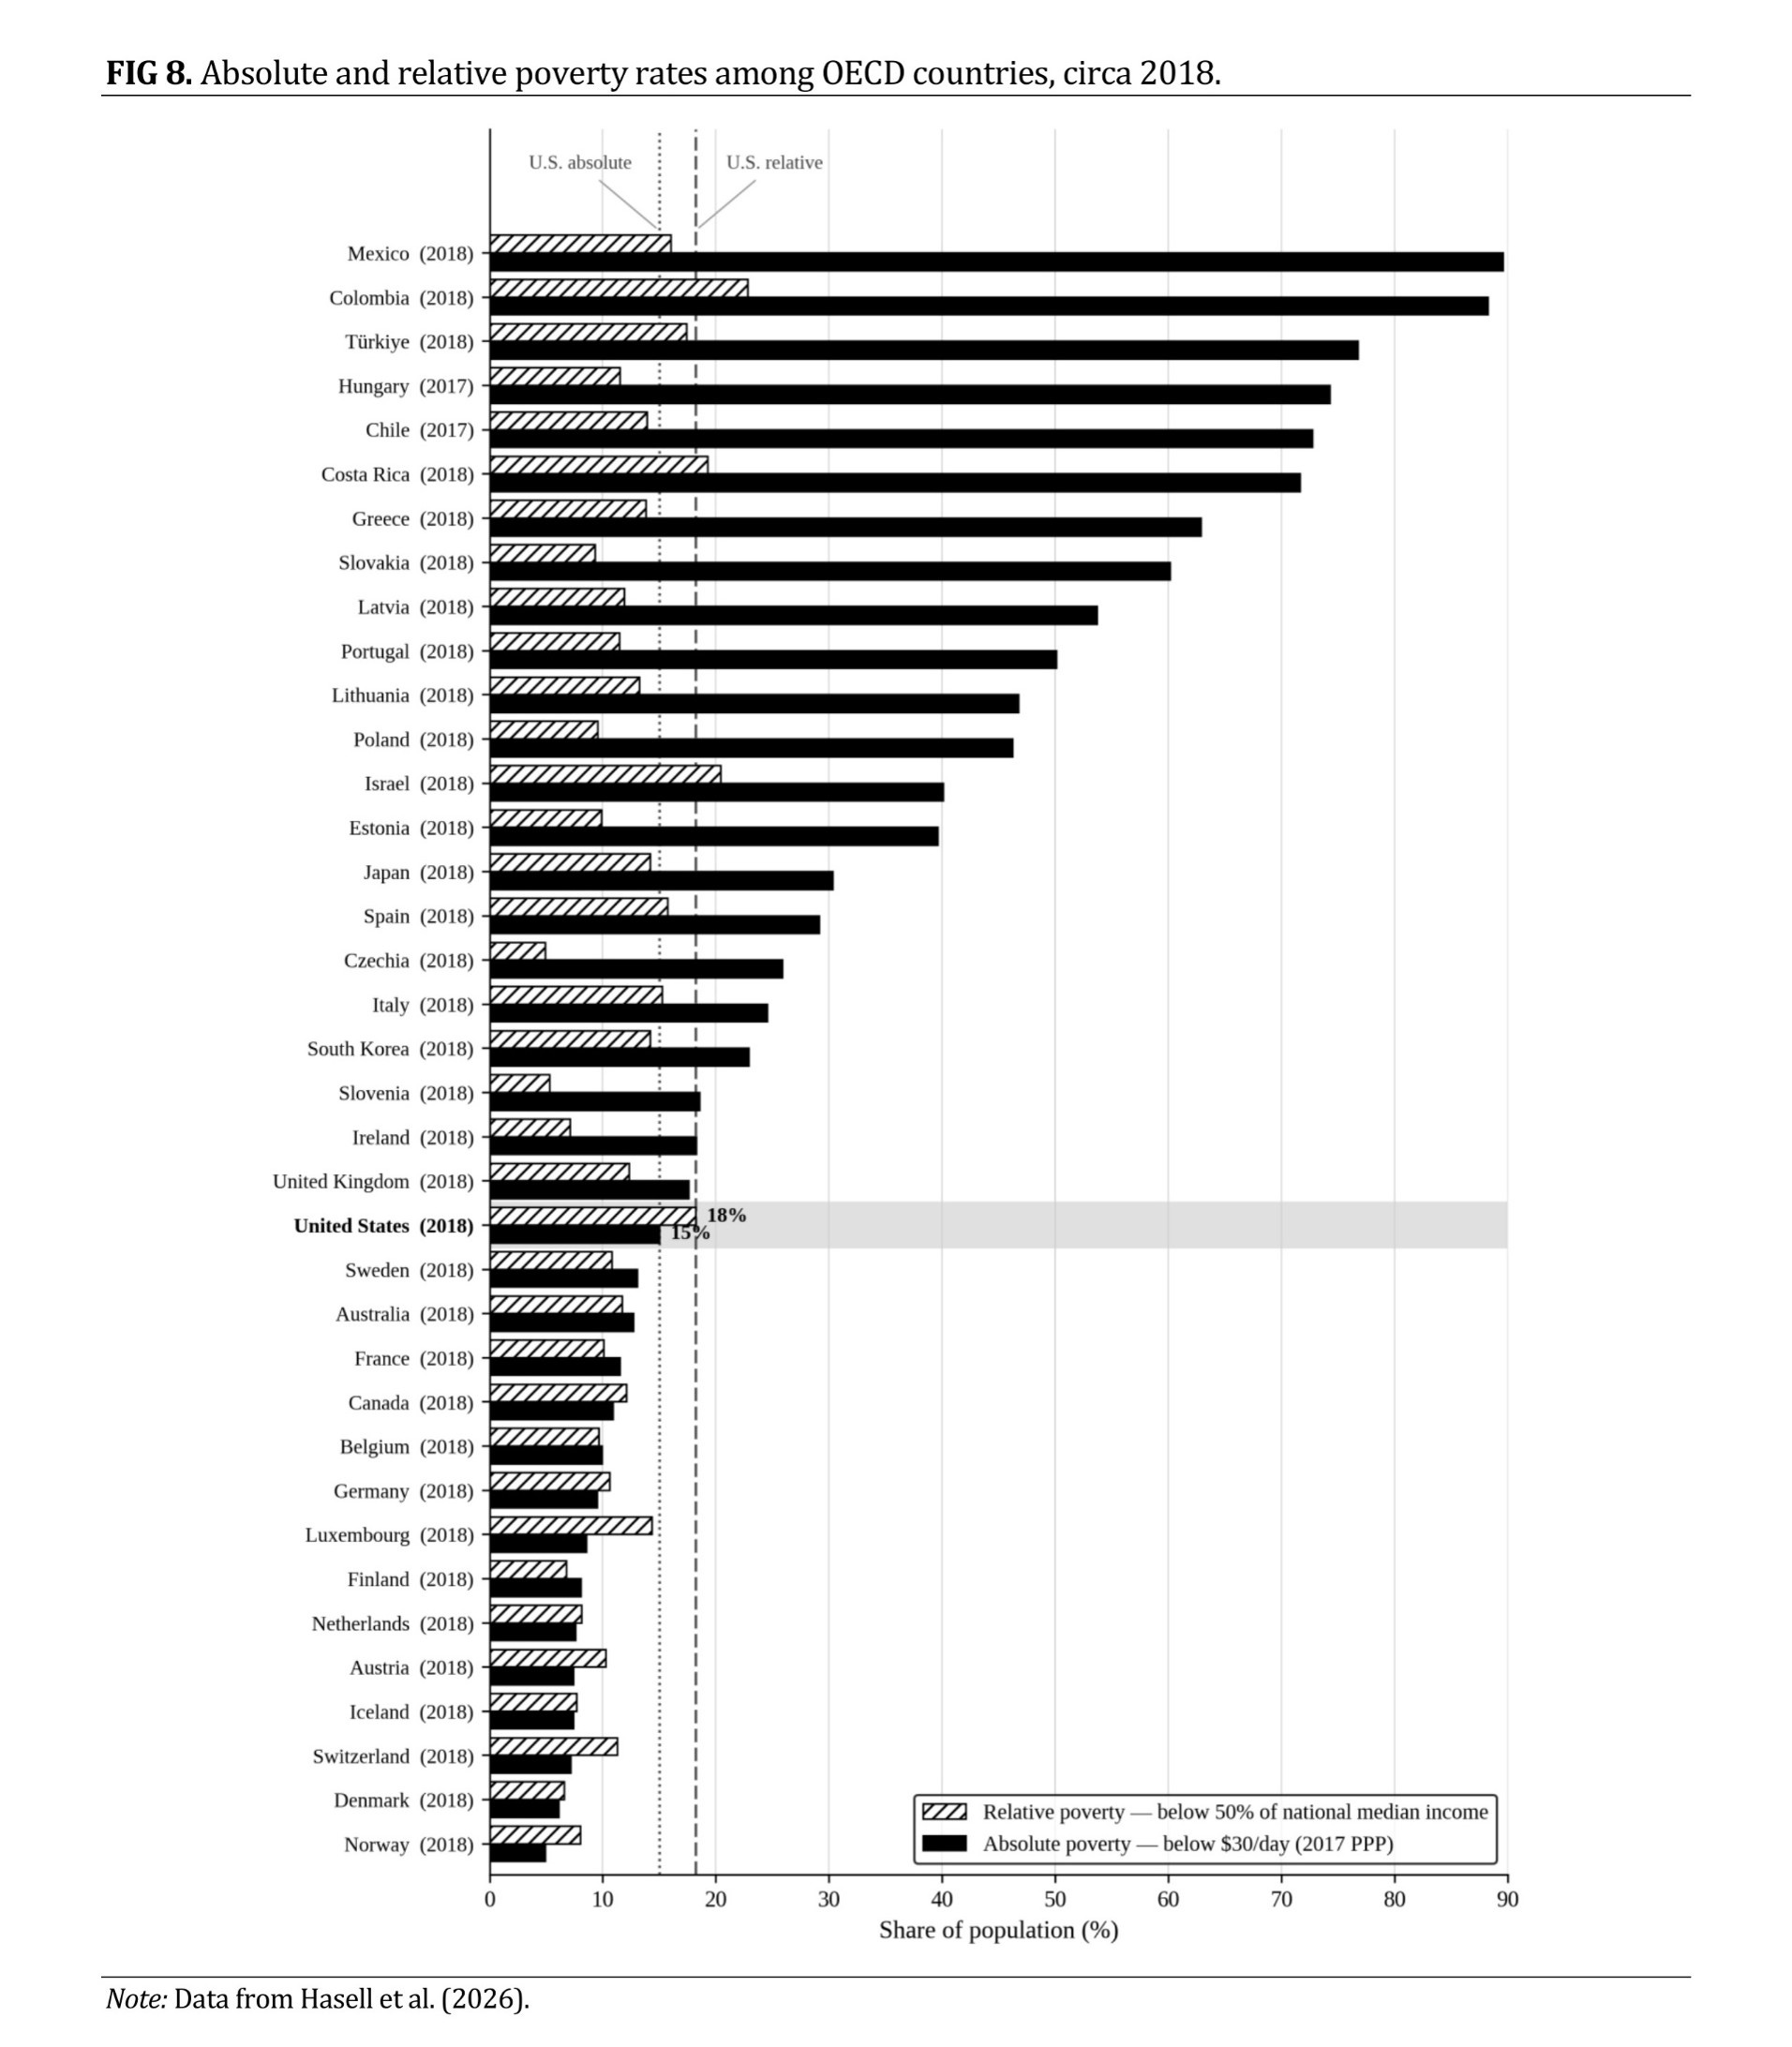
But over time, as I presented this information to classroom after classroom full of impressionable college students, I eventually started looking at my slides with an increasing sense of concern. As you can see in Figure 8 below, the U.S. is among the leading OECD countries when it comes to poverty when using a relative measure (50% of national median income). The more and more I presented this information, however, the more I began to question: do some of these countries really have that much less poverty than the U.S.?
Does Estonia (8.8% relative poverty rate in most recent year 2023), as one example, really have half as much poverty as the U.S. (18.6% the same year)? Was poverty really worse in the U.S. (18.9% in 2024) than in Mexico (15.7% the same year)? I’ve been to Mexico, and it certainly appeared to have a more substantial poverty problem than the U.S. So I started taking a closer look.
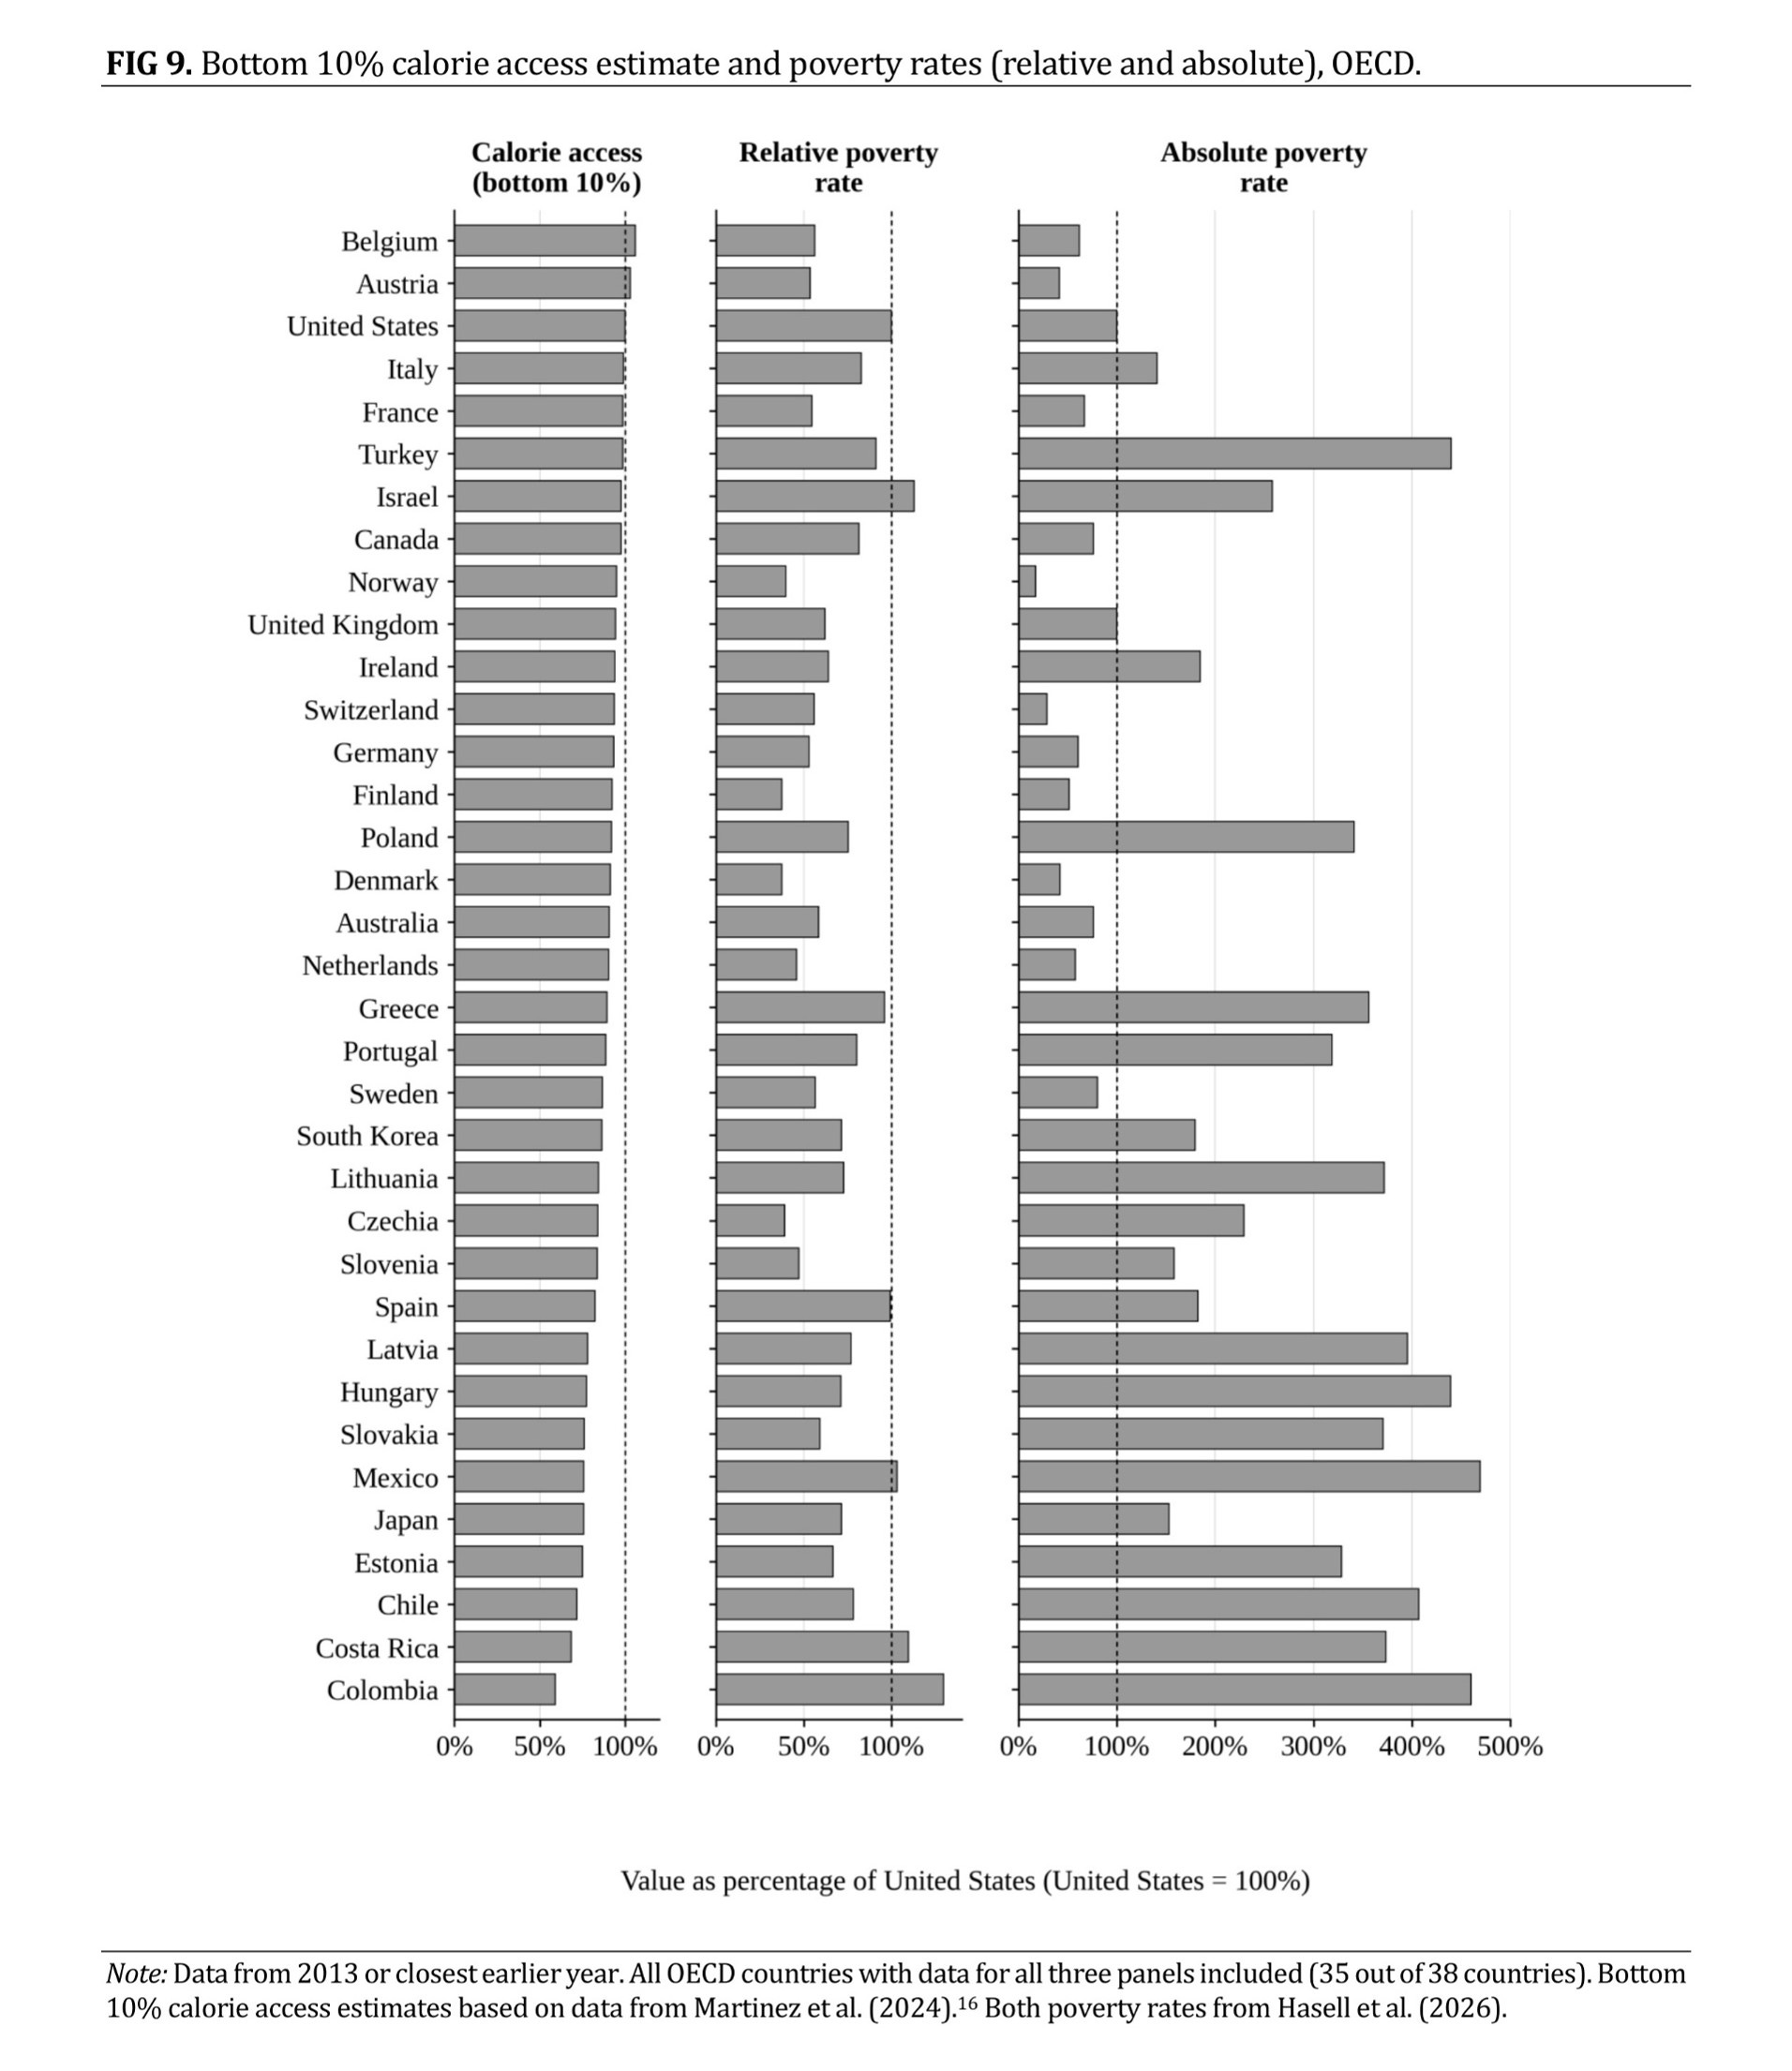
Despite supposedly having half the poverty as the U.S., for instance, one estimate has the bottom decile in Estonia accessing only about 75% as many calories as the bottom decile in the U.S. (see Figure 9 below).59 If poverty means hunger, that fact does not seem to align well with relative poverty rates.
In the U.S., the bottom decile in that same year spent about $22.12 per day, compared with only $10.77 in Estonia (48.7% of the U.S.).60 If poverty means having little money, this fact is also misaligned with relative measures.
The U.S. absolute poverty rate (< $30/day) was 19.2% that same year, just 30% of Estonia’s 63.1%61—which makes more intuitive sense to me if there is less money and more hunger among Estonia’s poor than America’s.62
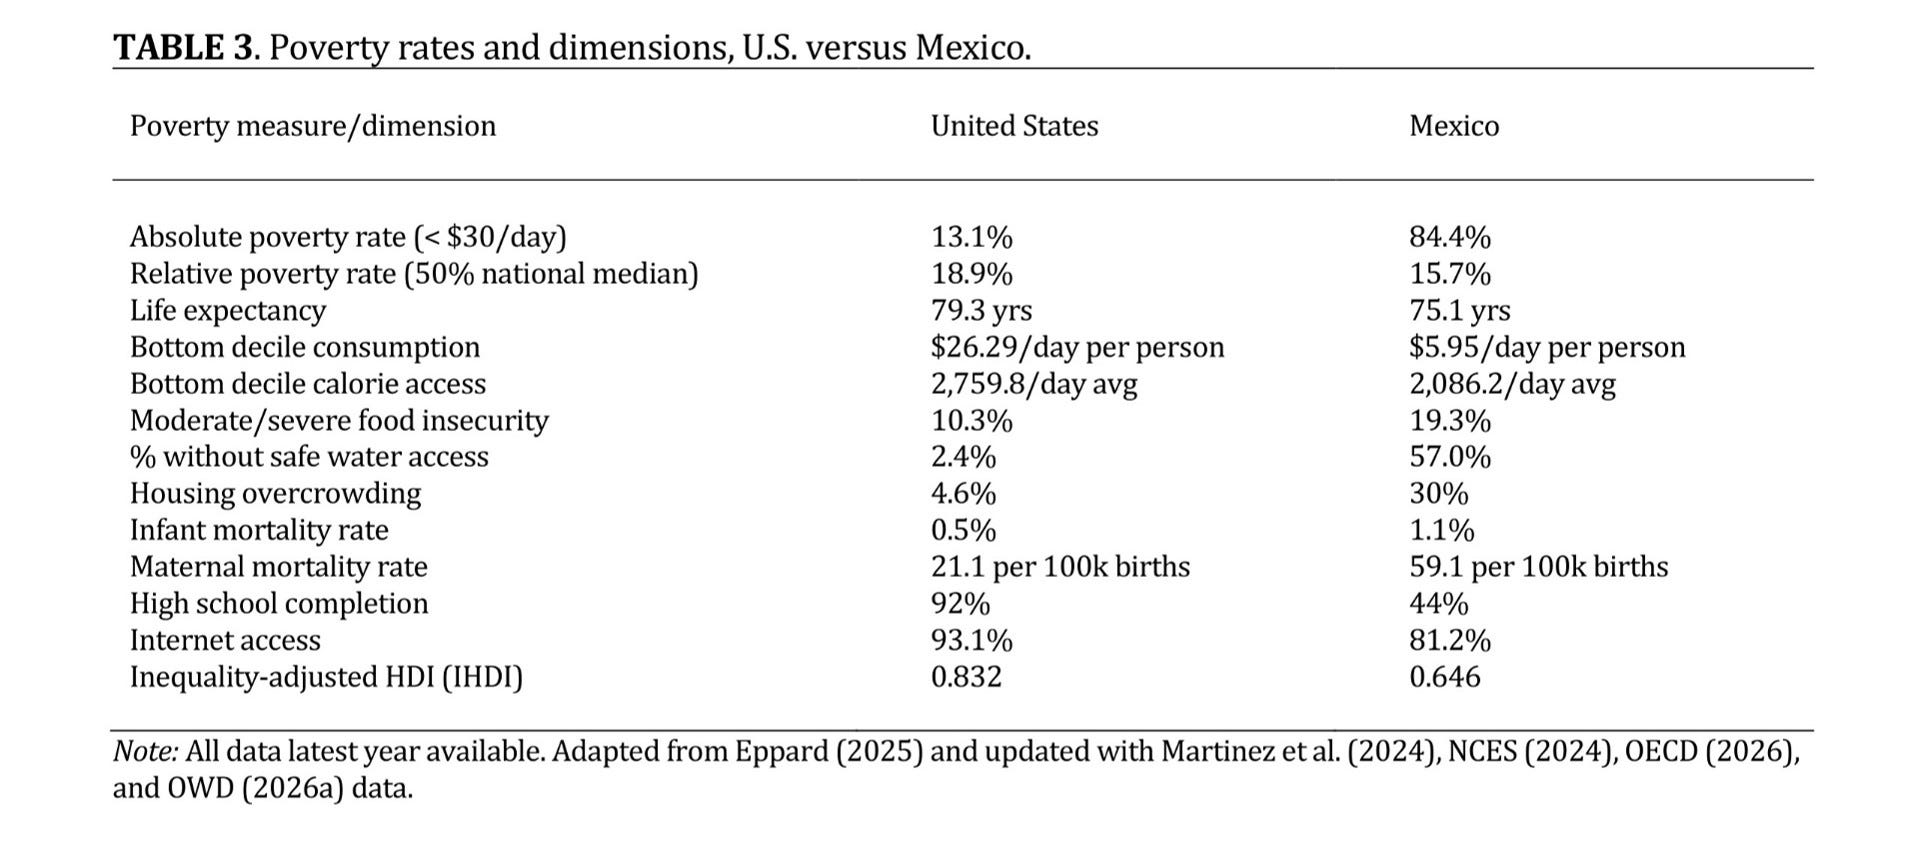
What about Mexico? Take a look at Table 3 below based on one of my publications on this topic.63 If you measure poverty in numerous other ways besides the relative measure, Mexico has far more poverty than the U.S. It isn’t really close.
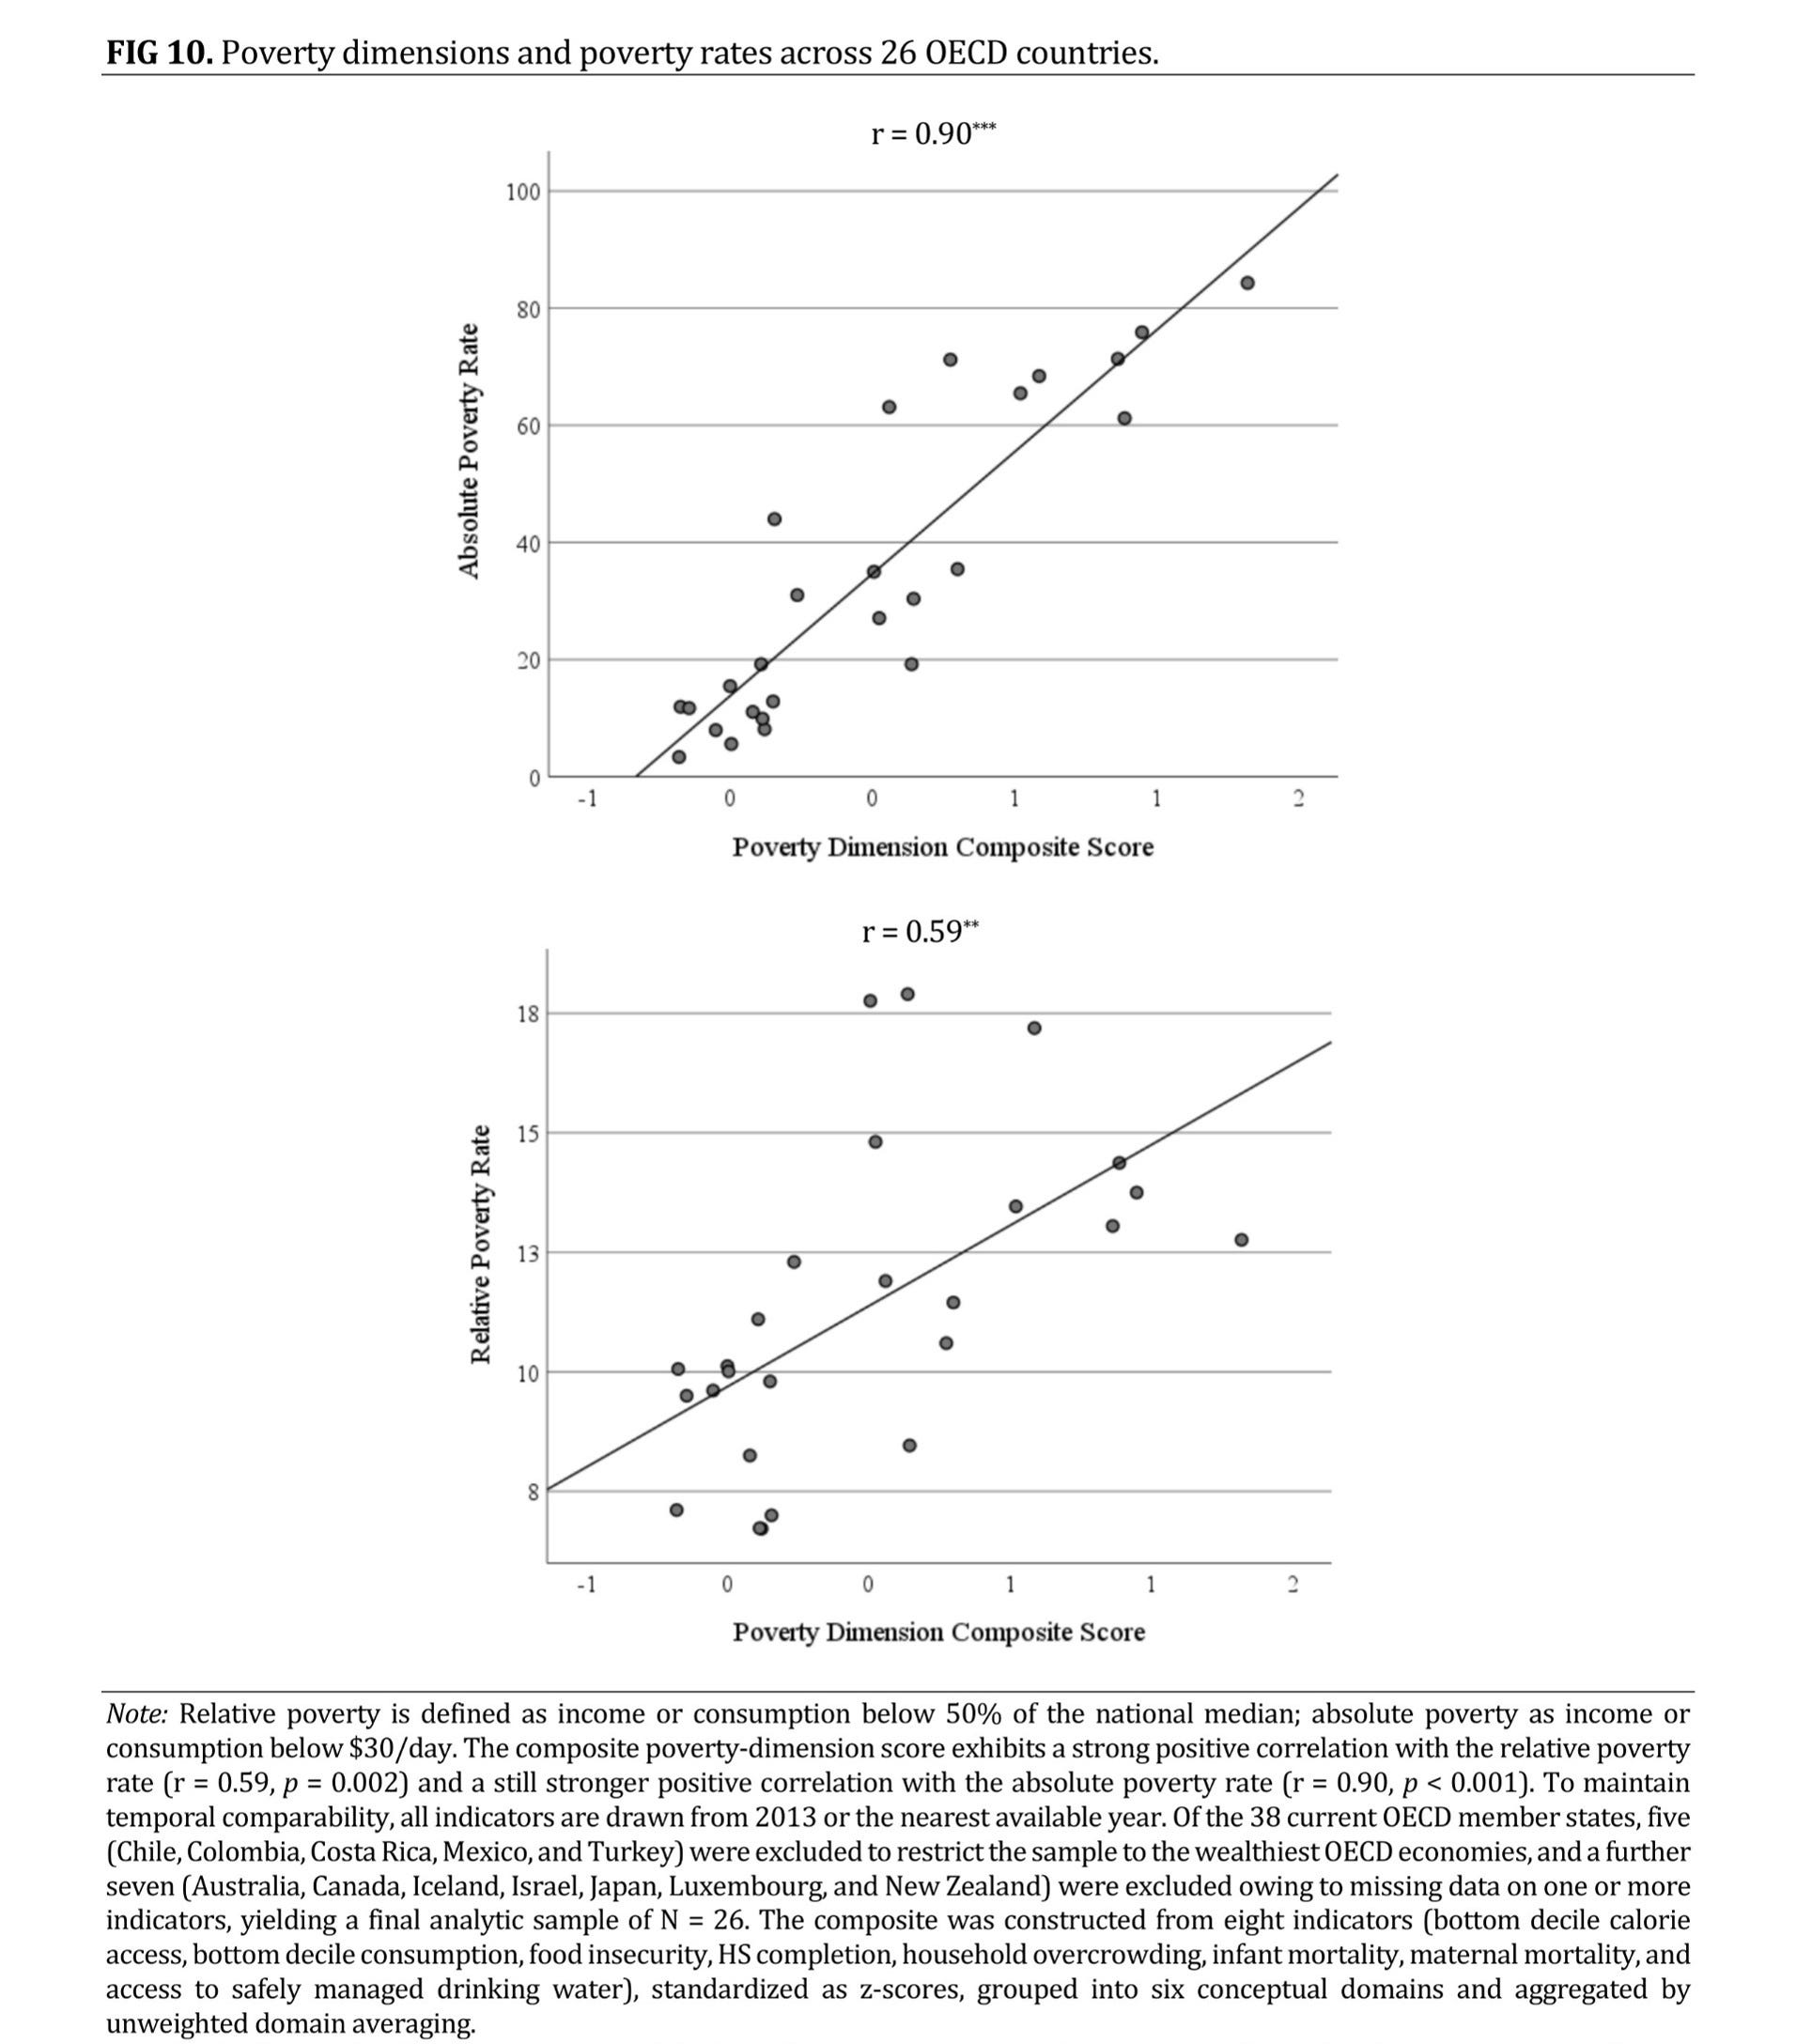
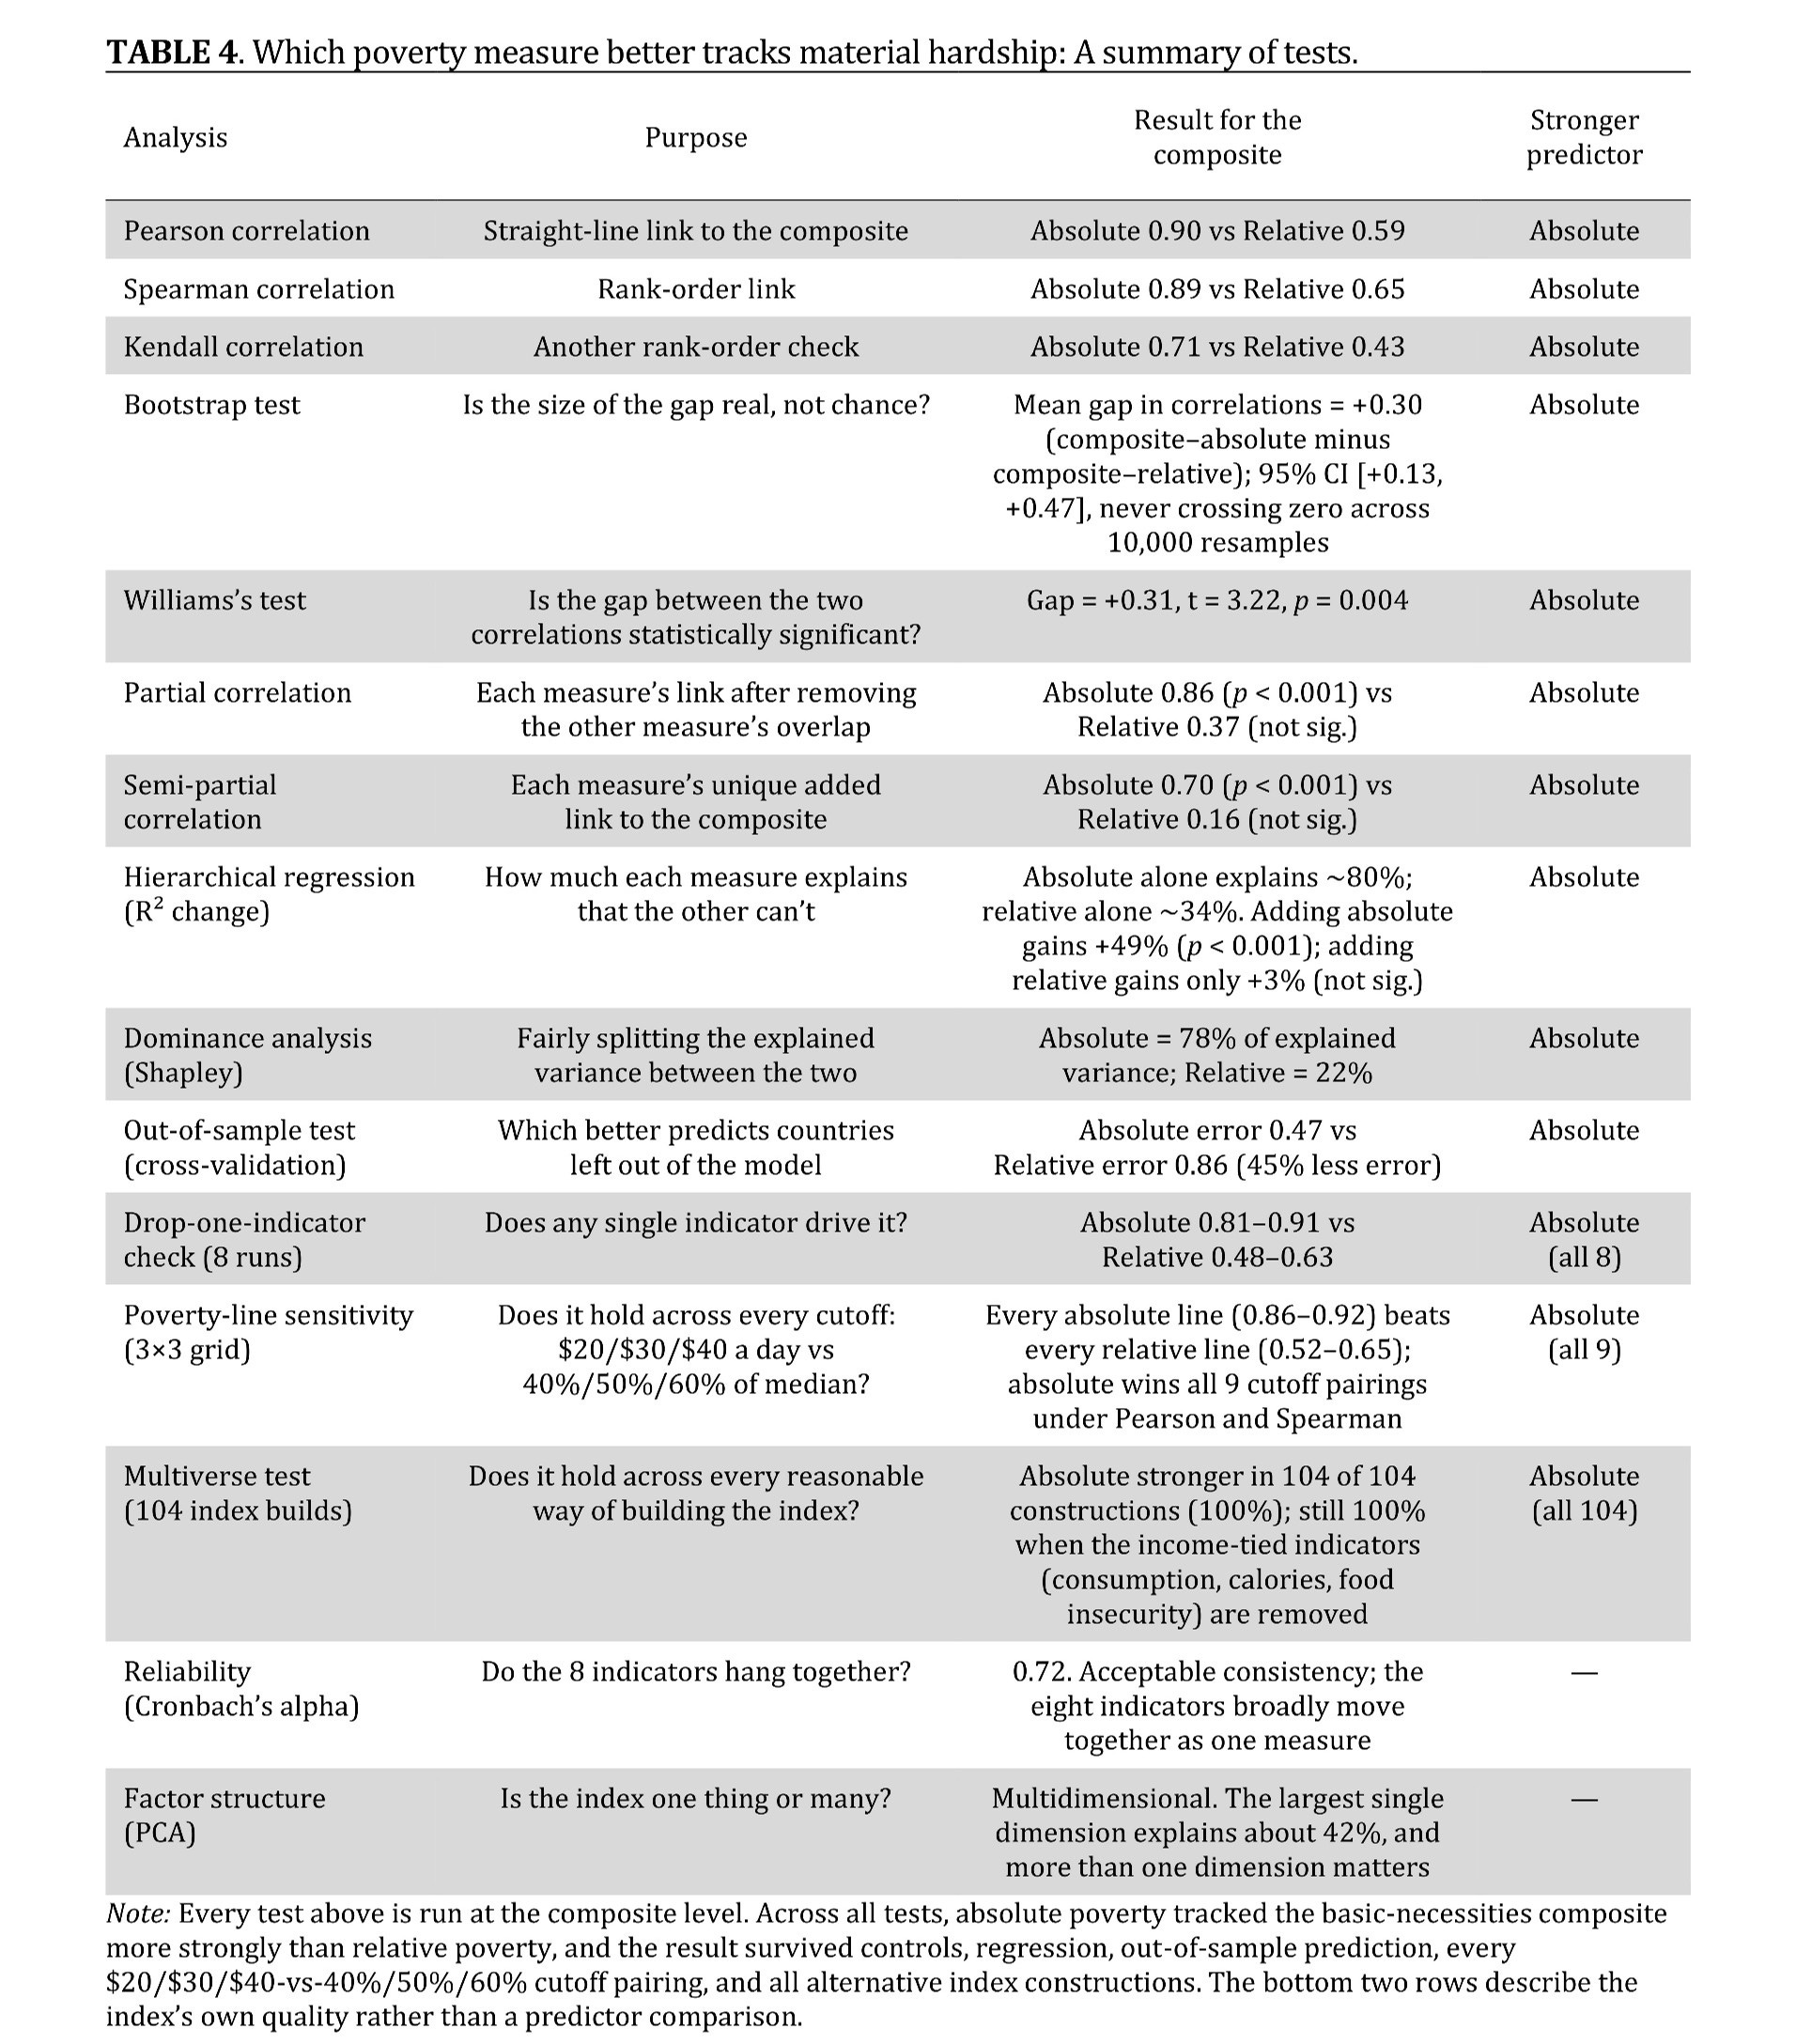
When I built a direct index of material hardship (bottom 10% calorie access, bottom 10% consumption, food insecurity, high school completion, housing overcrowding, infant mortality, maternal mortality, and safe water access) and asked which conception of poverty tracked it, the answer was lopsided (see Table 4 and Figure 10 below). The absolute measure (share of people living below a fixed material threshold) explained roughly 80% of the variation between wealthy OECD countries; the relative measure (share below half the national median income) explained barely a third, and once the absolute rate was known the relative rate added almost nothing. The pattern was not an artifact of one test or one cutoff: it held across several statistical approaches and under every poverty line I tried, and it persisted in every specification even when I stripped out the indicators closest to income itself—a consistency that is unsurprising once one recognizes that correlations of this kind are largely invariant to how the index is scaled and weighted. The moral is not that relative poverty is empty—it is a serviceable barometer of inequality—but that we should stop mistaking a barometer of inequality for a measure of what many people hear in the word poverty.
We use a single word, poverty, for two ideas that pull in opposite directions. One asks whether people have enough to survive—enough food, shelter, and clean water; conditions decent enough that an infant lives to see its first birthday. The other asks whether one can participate in the normal life of their society. These are not two lenses on one phenomenon, in my opinion, but two phenomena, and across affluent OECD countries they diverge sharply.
The point of these analyses is not to flatter any particular country (like my own). My view is this: measure what you mean and let the ranking fall where it does. When you do—when “poverty” means going without rather than having less than your neighbor—the United States is not the worst in the wealthy world but lands somewhere between the middle of the pack and a bit worse than the average, even as it ranks dead last on the relative measure that drives the familiar headline. If a country still looks bad by an honest material standard, so be it. The standard should match the word.
Leading poverty scholars who use relative measures, like David Brady here, are quite explicit about its theoretical basis:
“[T]he very meaning of what counts as a need is always defined within a place and time. Rather than an absolute list of physiological and caloric necessities that transcends time and place, needs become ‘needs’ as a society or community evolves. . . [R]elative measures can assess whether people have fallen far below the living conditions and customary standards of the majority of the contemporary society or community in which they reside.”64
I wasn’t unaware that relative measures were not measuring material deprivation—it’s right there in the word “relative.” In fact, I read the relevant work (such as Peter Townsend, Amartya Sen, Anthony B. Atkinson, David Brady, Timothy Smeeding, European statistical agencies, and several others) in graduate school and knew how they incorporated things like well-being, social exclusion and isolation, inequality, capability deprivation, opportunity access, relative status, social participation, social shame, health and life chances, and other dimensions into their conceptions of poverty. What I did not yet appreciate was just how far removed from material deprivation relative measures were. I never bothered to check.
Many leading poverty scholars will counter that it is difficult to construct an absolute measure that holds up across countries and across historical eras. But that objection applies at least as forcefully to the relative measure. Because a relative line floats with each country’s own median, it can rank one nation as poorer than another even when its “poor” are materially better off than the other’s—the line is measuring distance from each society’s middle, not anyone’s actual standard of living. A relative measure can label a millionaire who wants for nothing as “poor,” so long as enough of his or her neighbors are billionaires.
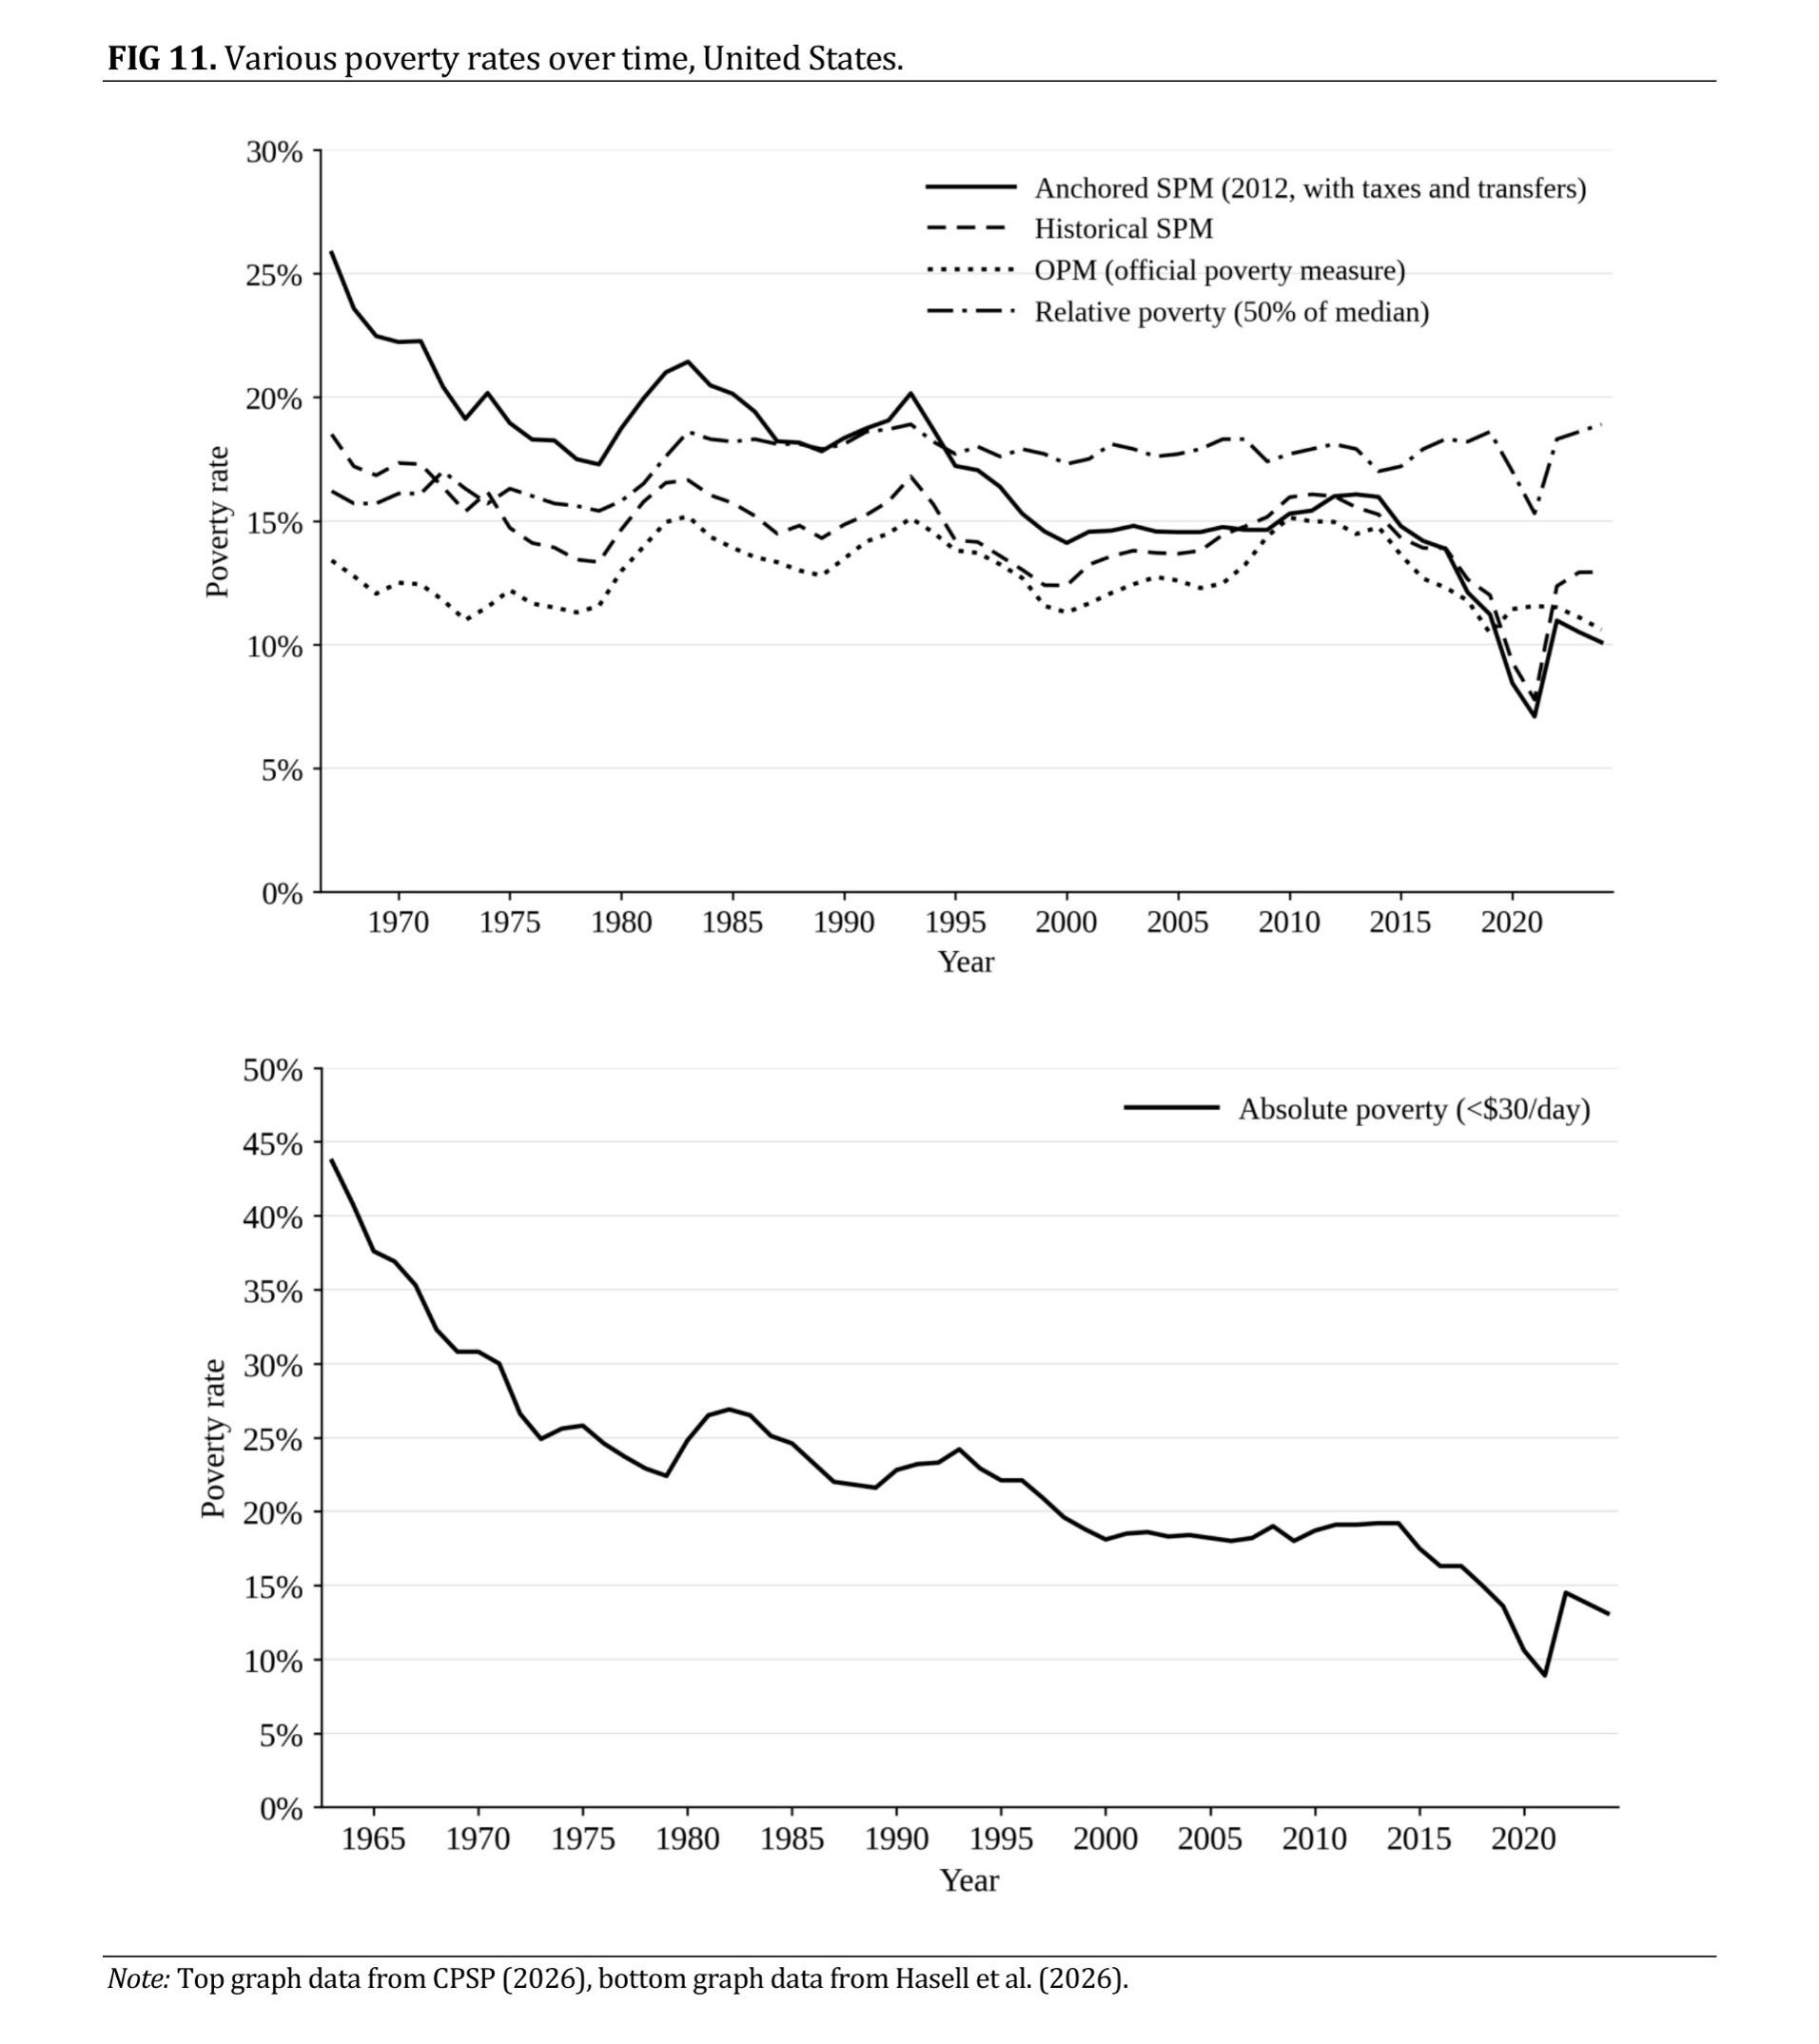
The same flaw appears across time. A relative measure can move in the wrong direction even as the material lives of the poor improve: by the 50% relative measure, the share of Americans counted as poor rose from the 1960s to today, even as the poor came to enjoy living standards that the poor of the 1960s could not have imagined (see Figure 11 below).65 To claim that poverty today is worse than it was in the middle part of the 20th century is an absurdity. A measure on which six decades of transformed material conditions register as more poverty, not less, is no more “comparable across time” than the absolute measure its own defenders reject on precisely that ground.
If sociology wishes to measure poverty this way, so be it. But we should be more upfront with our students and with the public about just what we mean when we say “poverty.” I have several journalist friends, for instance, and even some of the most conservative ones are unaware of what the relative measure actually assesses.
I’ve published multiple books claiming that poverty in the U.S. is an outlier in the wealthy world. I’m embarrassed to admit that I now believe I was mistaken. Why didn’t I question this sooner? Multiple reasons.
I wasn’t curious enough. That’s how I was trained in graduate school, and I took my field’s word for it. The relative measure was the measure serious sociologists used; the absolute measure was the one that other fields and many conservatives used, and I absorbed the implicit hierarchy without examining it.
I followed the path of least resistance. Datasets using the relative measure seemed easier to find, the literature I cited used the relative measure, and conforming kept me in good standing in my field.
The relative measure affirmed my worldview at the time—that capitalism is bad, that the U.S. doesn’t care enough about the poor, that the welfare state should be expanded. The measure delivered conclusions I wanted, so I didn’t look at it as skeptically as I should have. I probably would have scrutinized it more if it had delivered the opposite conclusion.
And I can’t ignore the sunk-cost problem. The more I published using the relative measure, the more of my career’s work I would later have to admit was wrong. Once I’d built arguments on top of the measure in print, the cost of revisiting the foundation rose every year. Changing course would also have meant reconsidering my own lectures, syllabi, and recommended readings. A considerable amount of work, but also a kind of public unwinding I wasn’t eager to do.
If you look around, you will find poverty scholars like me using sleight of hand to make our case more compelling. As with Alexander’s sloppiness around definitions that I discussed earlier, we often play definitional games to strengthen our arguments.
As an example: students of mine were recently raving about Matthew Desmond’s Poverty, by America, which another professor had assigned in their course. I respect Desmond a great deal; he is a far more accomplished researcher than I am—if he’s in the stratosphere of American poverty scholars, I’m buried somewhere in the Earth’s crust. So I grabbed a copy to see what was energizing my students.
So much of what he said was compelling and strongly evidenced, and I am not here to tear him, his book, or his core arguments down. But I winced in several spots as I observed him doing what I and many others are often guilty of: overclaiming and making misleading statements in support of a point we are trying to impress upon our audience. In Desmond’s case overclaiming wasn’t necessary, since his main argument was compelling; but some of the claims he marshals in support of his main thesis give the reader a wildly distorted view of several issues.
In the book he proclaims that:
“This is who we are: the richest country on earth, with more poverty than any other advanced democracy.”66
This is true if you use a relative measure (which he uses when convenient to one claim but not when inconvenient to another one), as I have discussed. But if you use a measure that fits what many people intuitively think of as poverty—lacking basic necessities—the U.S. is somewhat average or slightly worse than average among wealthy countries (refer back to Figure 8).67 When you leave this complexity out of your argument, it makes it more rhetorically forceful but less honest.
Another major empirical claim in the book—one that is the main focus of chapter 2, “Why Haven’t We Made More Progress?”—is that poverty has shown no meaningful decline since the 1960s:
“To graph the share of Americans living in poverty over the past half century amounts to drawing a line that resembles gently rolling hills. . . There is no real improvement here, just a long stasis. . . Difference measures spit out the same embarrassing result.”68
This claimed stagnation has happened, he writes, despite massive increases in anti-poverty spending, implying that government programs have been ineffective. This is highly misleading. To make this argument he uses a different measure from the relative one: he uses the official poverty measure or OPM (see Figure 11 below) published by the U.S. Census Bureau. His claim, that poverty hasn’t changed much since the 1960s, is only true if you ignore the impacts of all that spending he talked about (food stamps, the EITC, Medicaid etc.). Desmond chooses to use a measure, the OPM, that by design does not capture the effects of the programs he claims are failing. Measures that do account for this spending, such as the Supplemental Poverty Measure (SPM), show that poverty in the U.S. has actually declined over time (and the relative measure, as I noted earlier, shows poverty has increased since the 1960s, which in my opinion is nonsensical). As John Iceland points out:
“[A] crucial problem is that the OPM only counts cash income. It doesn’t include noncash and near-cash income, such as the Earned Income Tax Credit, housing subsidies, and Medicaid benefits. These benefits have all grown substantially over the past several decades, making the measurement problem worse over time. . . As a result, the OPM undercounts the resources families have to meet their basic needs and thus overcounts the number of people who are poor. . . Poverty measures that account for these and other deficiencies show a marked downward trend in poverty.”69
Another central claim in the book—the focus of chapter 5, “How We Rely on Welfare,” is that “the biggest beneficiaries of federal aid are affluent families.”70 Desmond quantifies this claim:
“The most recent data compiling spending on social insurance, means-tested programs, tax benefits, and financial aid for higher education show that the average household in the bottom 20 percent of the income distribution receives roughly $25,733 in government benefits a year, while the average household in the top 20 percent receives about $35,363. Every year, the richest Americans families receive almost 40 percent more in government subsidies than the poorest American families.”71
This is highly misleading because it puts the focus solely on the distribution side of the equation.
According to the Tax Foundation, for instance, if you subtracted the taxes paid by the bottom fifth of earners from the government benefits they received in 2019, there was money left over—they got more from the government than they paid in. How much more? $1.27 for every dollar they earned. Now do the same math for the top fifth. Subtract their taxes from their benefits, and the number is negative—they paid far more than they got back, to the tune of about 31 cents for every dollar earned. And that top fifth funded 90% of all government transfers that year.72
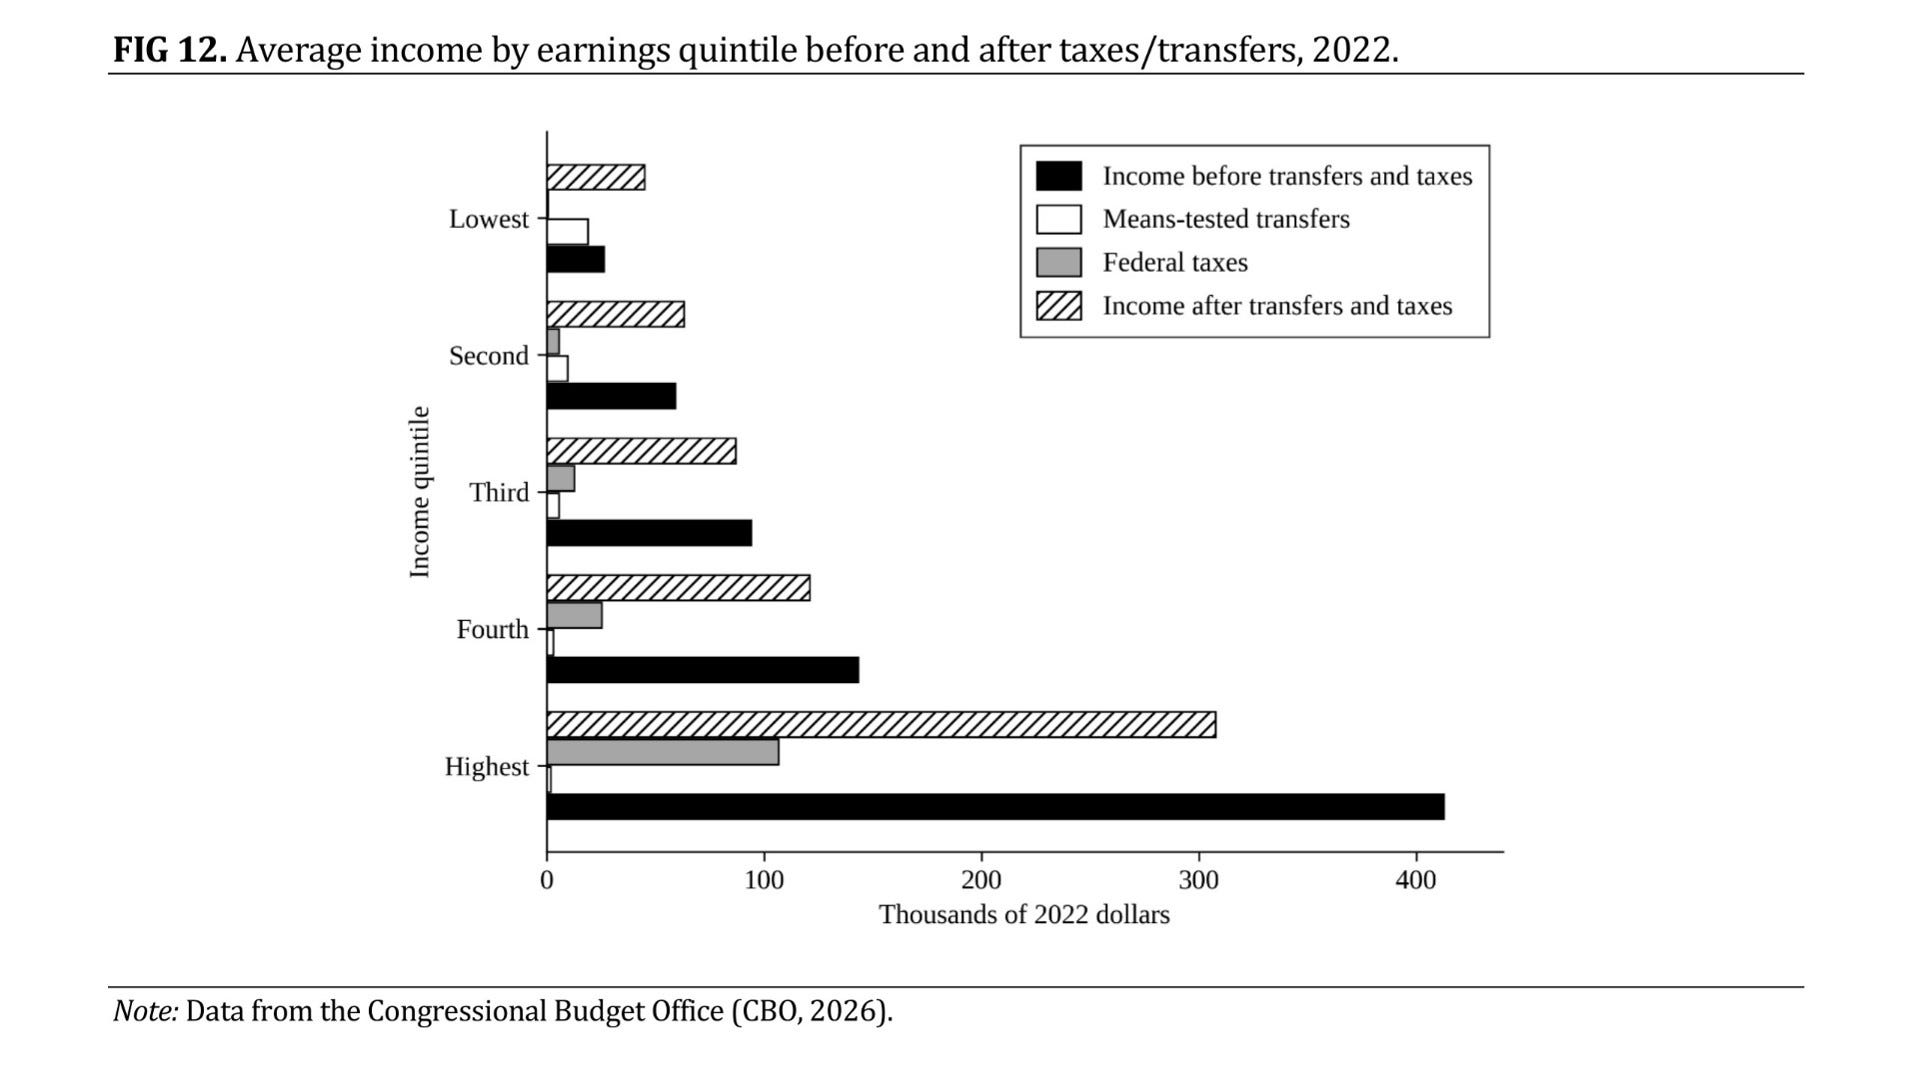
Other sources reach the same directional conclusion. According to the Congressional Budget Office (CBO), in 2022 means-tested transfers and federal taxes decreased the average income of households in the highest quintile (a net loss of about 25 cents for every dollar of income before transfers and taxes), while increasing income among those in the lowest quintile (a net gain of about 71 cents for every dollar of income before transfers and taxes) (see Figure 12 below).73
Desmond counts what affluent households receive from the government but ignores what they pay in, obscuring that they are large net contributors to a system that, on net, transfers substantially downward.
Later in the book Desmond writes that, while some may “conclude that single parenthood is a major cause of poverty,” this isn’t true. He writes that this is because “A study of eighteen rich democracies found that single mothers outside the United States were not poorer than the general population.”74 He goes on to write that:
“Choosing to have a child outside of marriage may be an individual choice, but condemning many of those parents and their children to a life of poverty is a societal one.”75
The study he cites, however, actually shows single mother families are disproportionately poor in all of the countries studied.76 Across all 17 non-U.S. countries in this study’s dataset, single mother families were disproportionately poor relative to the general population in every case without exception, at an average ratio of roughly 2.7 to 1. Countries like the Netherlands (7.5x), Luxembourg (4.0x), Germany (3.7x), and France (3.6x) actually showed a wider single-mother poverty gap than the U.S. (2.4x). In fact, the U.S. ratio of 2.42 fell below the cross-national mean of 2.66, meaning the relative disadvantage of being a single mother is, on average, larger outside the U.S. than within it. Single-mother families’ risk of poverty differs from country to country, but their risk is disproportionately higher everywhere, nonetheless. This is a mischaracterization that serves his argument against individual-level explanations of poverty, but it isn’t true.77
Overclaims, misleading claims—these are not simple mistakes, but empirical claims that are foundational to the book’s argument and are systematically distorted in one direction. Once more from John Iceland:
“Desmond undermines his call to action through his imbalanced treatment of trends in poverty and the effectiveness of economic growth and government programs in reducing it. This is a significant weakness: One needs a full understanding of a problem in order to prescribe the most efficient and effective solutions.”78
Every Lie Incurs a Debt to the Truth
Let me be clear that I’m not here to tear down Michelle Alexander, Matthew Desmond and other prominent poverty scholars, or anyone else. They are more important, more talented, and more accomplished than I am—and in any case the point was never to tear anyone down. I am as guilty of these missteps as anybody, and likely more so. But if academia doesn’t stop, if the social sciences don’t stop, if sociology specifically doesn’t stop—we will dig our own grave.
We have to change the incentives in our field. Reviewers, editors, hiring committees, and grant panels need to reward people for making better-evidenced claims rather than punishing them when those claims complicate the field’s preferred conclusions. Right now, too many incentives run in the opposite direction. As my colleague Jacob Mackey argues, to question many flawed but popular social justice claims is to oppose the noble goals of one’s tribe, or to signal that one does not take the problem seriously. The penalty for inconvenient correction is real, and most of us internalize it long before we ever feel it directly.
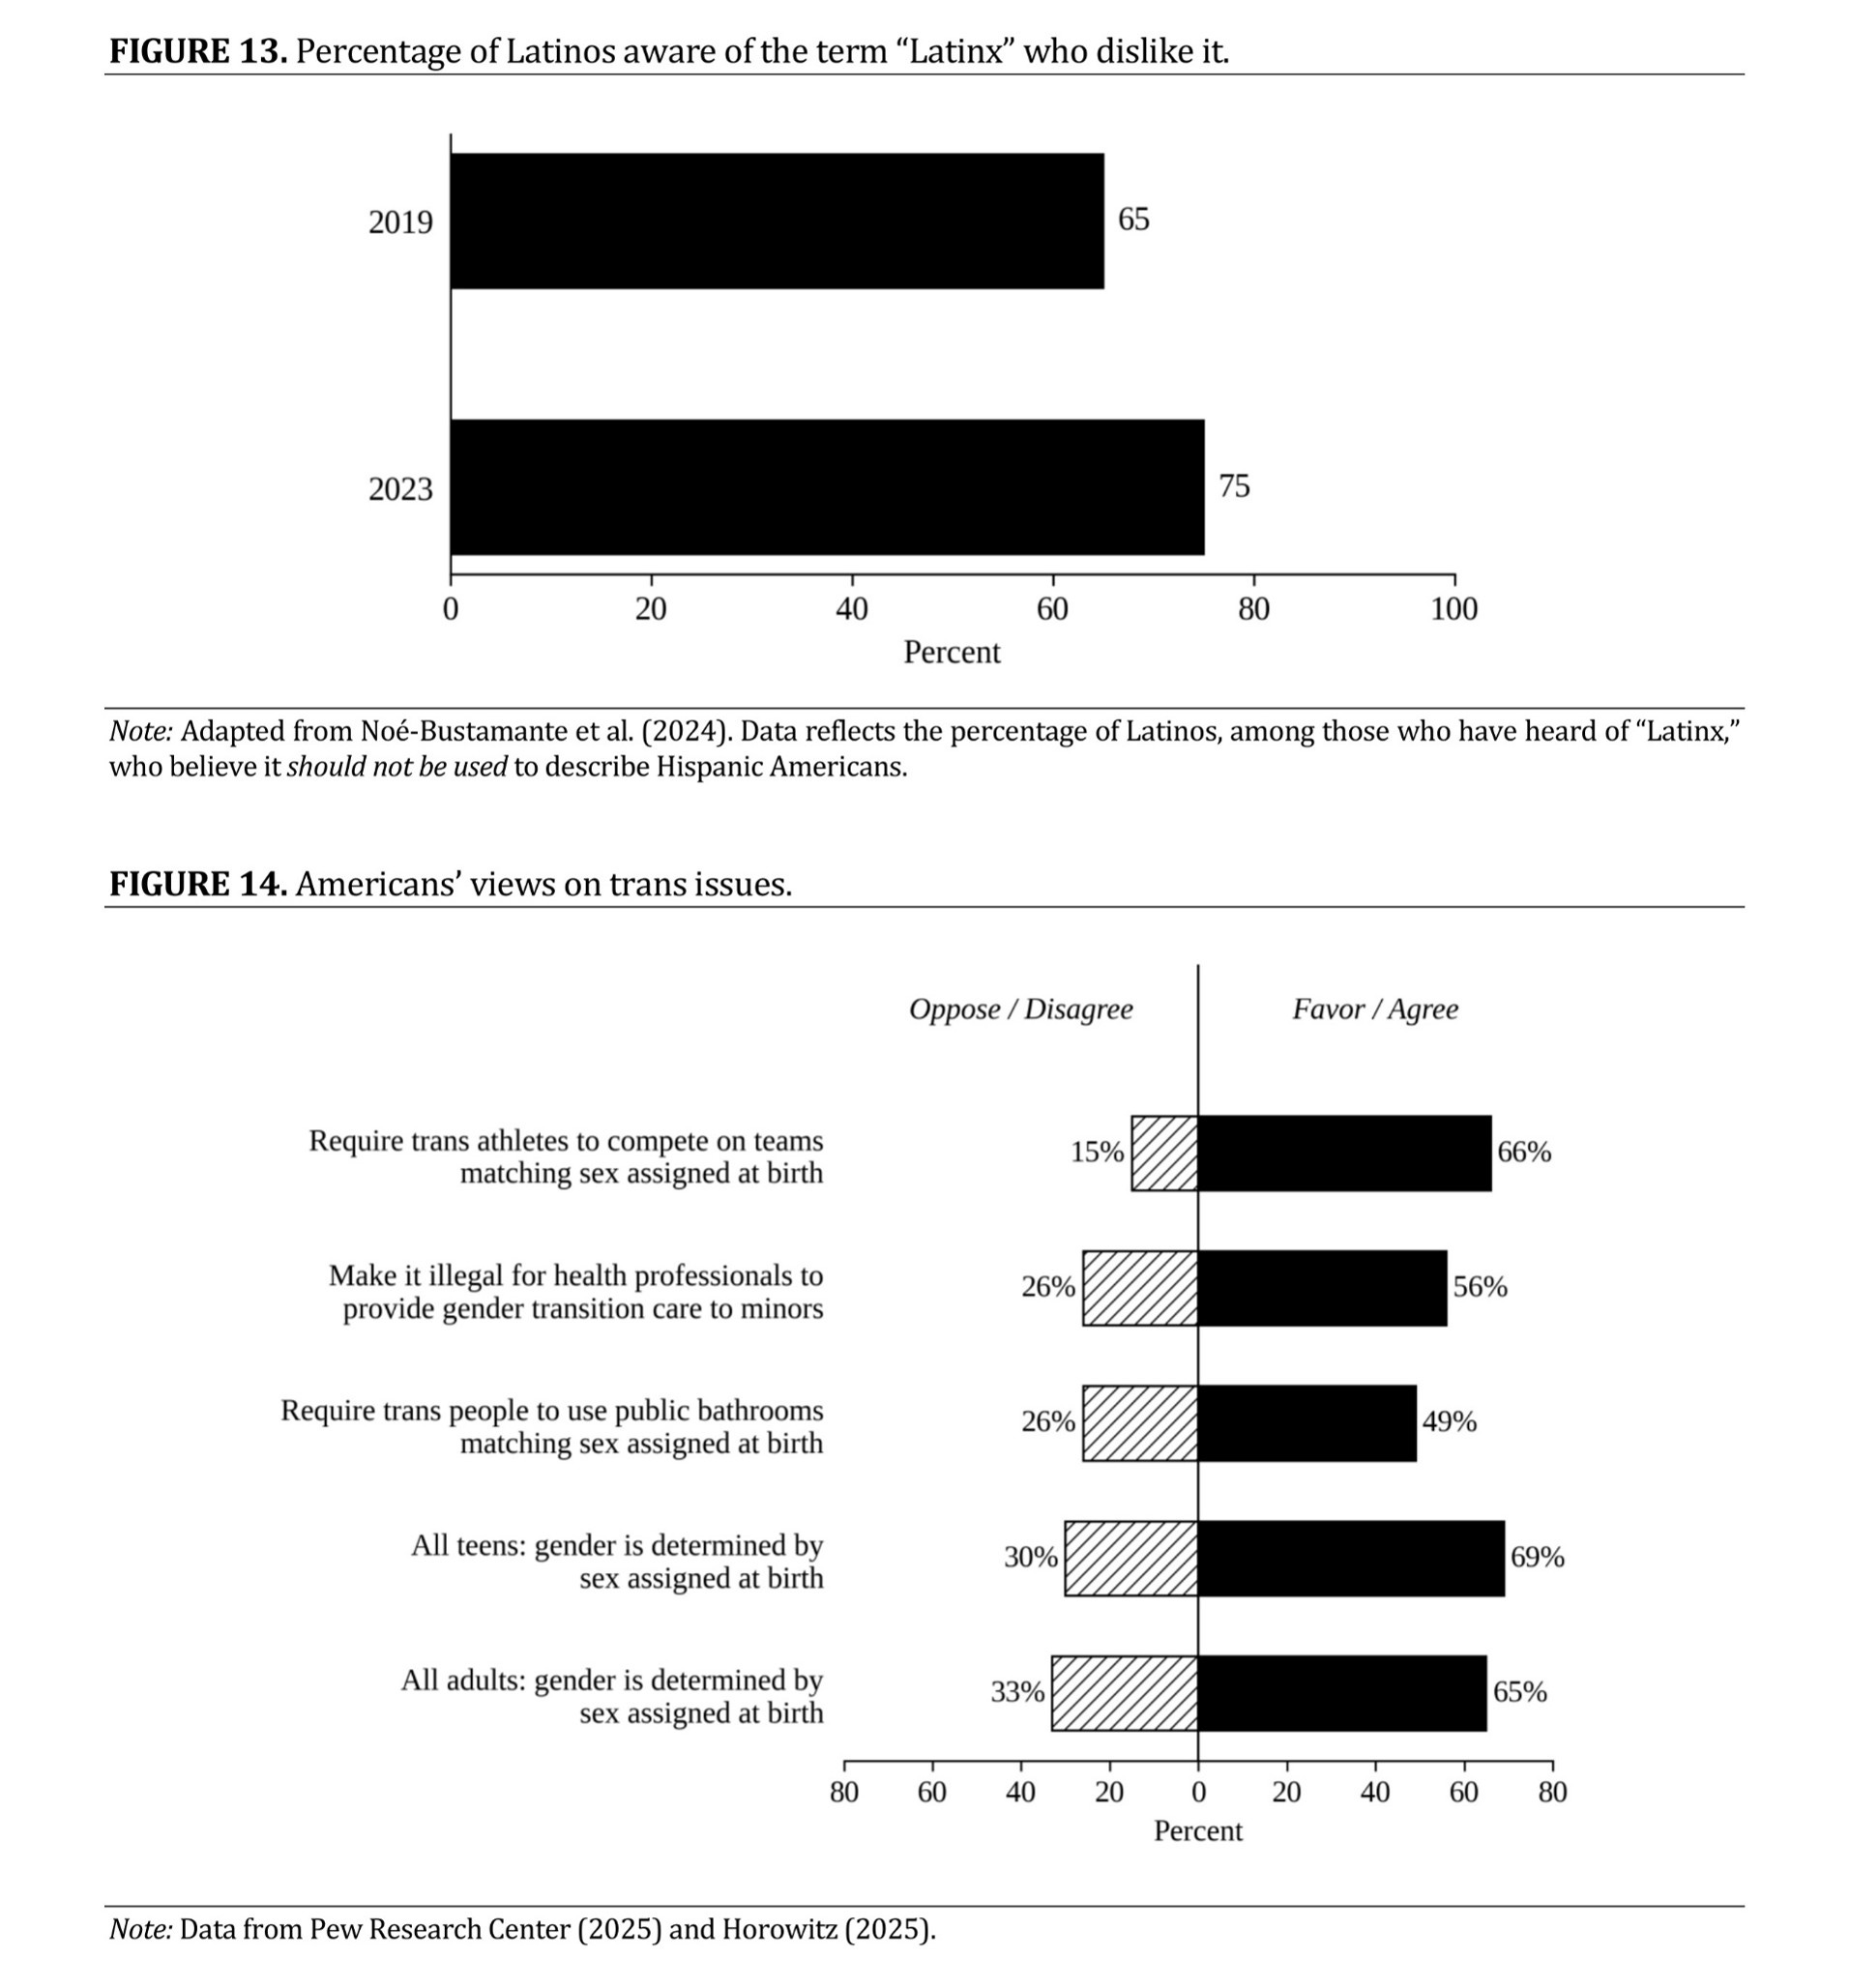
Some of what better incentives would help us correct is small. Take our insistence on labeling Hispanic Americans “Latinx,” despite the fact that something like 75% of Latinos (see Figure 13 below) who have heard the term wish we would stop.79 A small matter on its own, but a revealing one: we work in a profession where the incentives are to ignore what a minority group asks of us because we, the (often White) sociologists, know better.
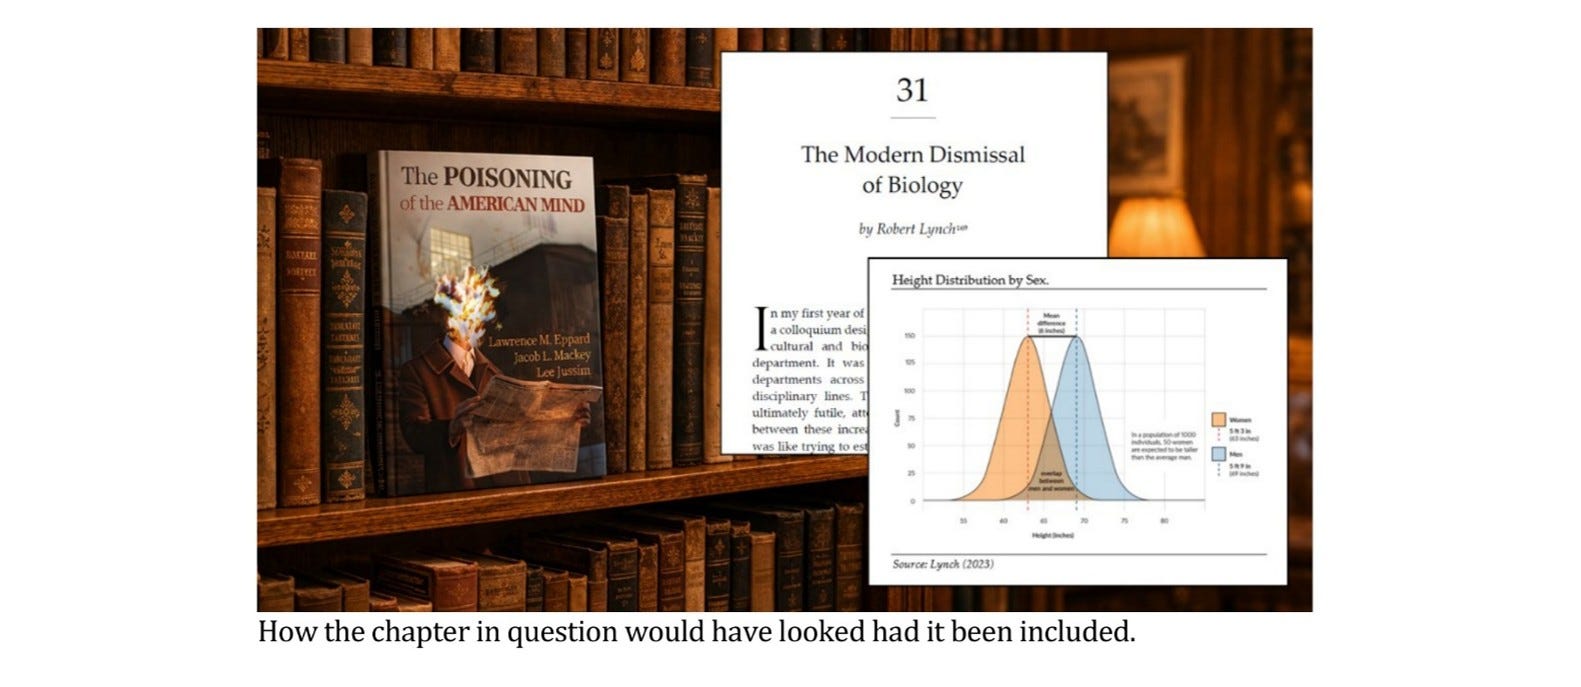
Other corrections would cut deeper. There are few orthodoxies as dangerous to violate in sociology today as those surrounding trans issues. To say that sex is at least as important as gender, that biological males should not compete in women’s sports or use women’s bathrooms, that we should not allow certain types of gender-affirming care for minors, or that you disagree that “Trans women are women”—such statements can get you cast out of sociology. We can argue all day about whether any one of these assertions is evidence-based. But casting people out for taking positions on genuinely contested questions, particularly positions where majorities of Americans agree with them (see Figure 14 below), is not the mark of a healthy academic discipline.
Jonathan Haidt has named the pattern directly:
“On the left, including the academic left, the most sacred issues involve race and gender. So that’s where you find the most direct and I’d say flagrant denial of evidence.”80
I think he’s right. And the cost of contradicting that sacredness is not hypothetical.
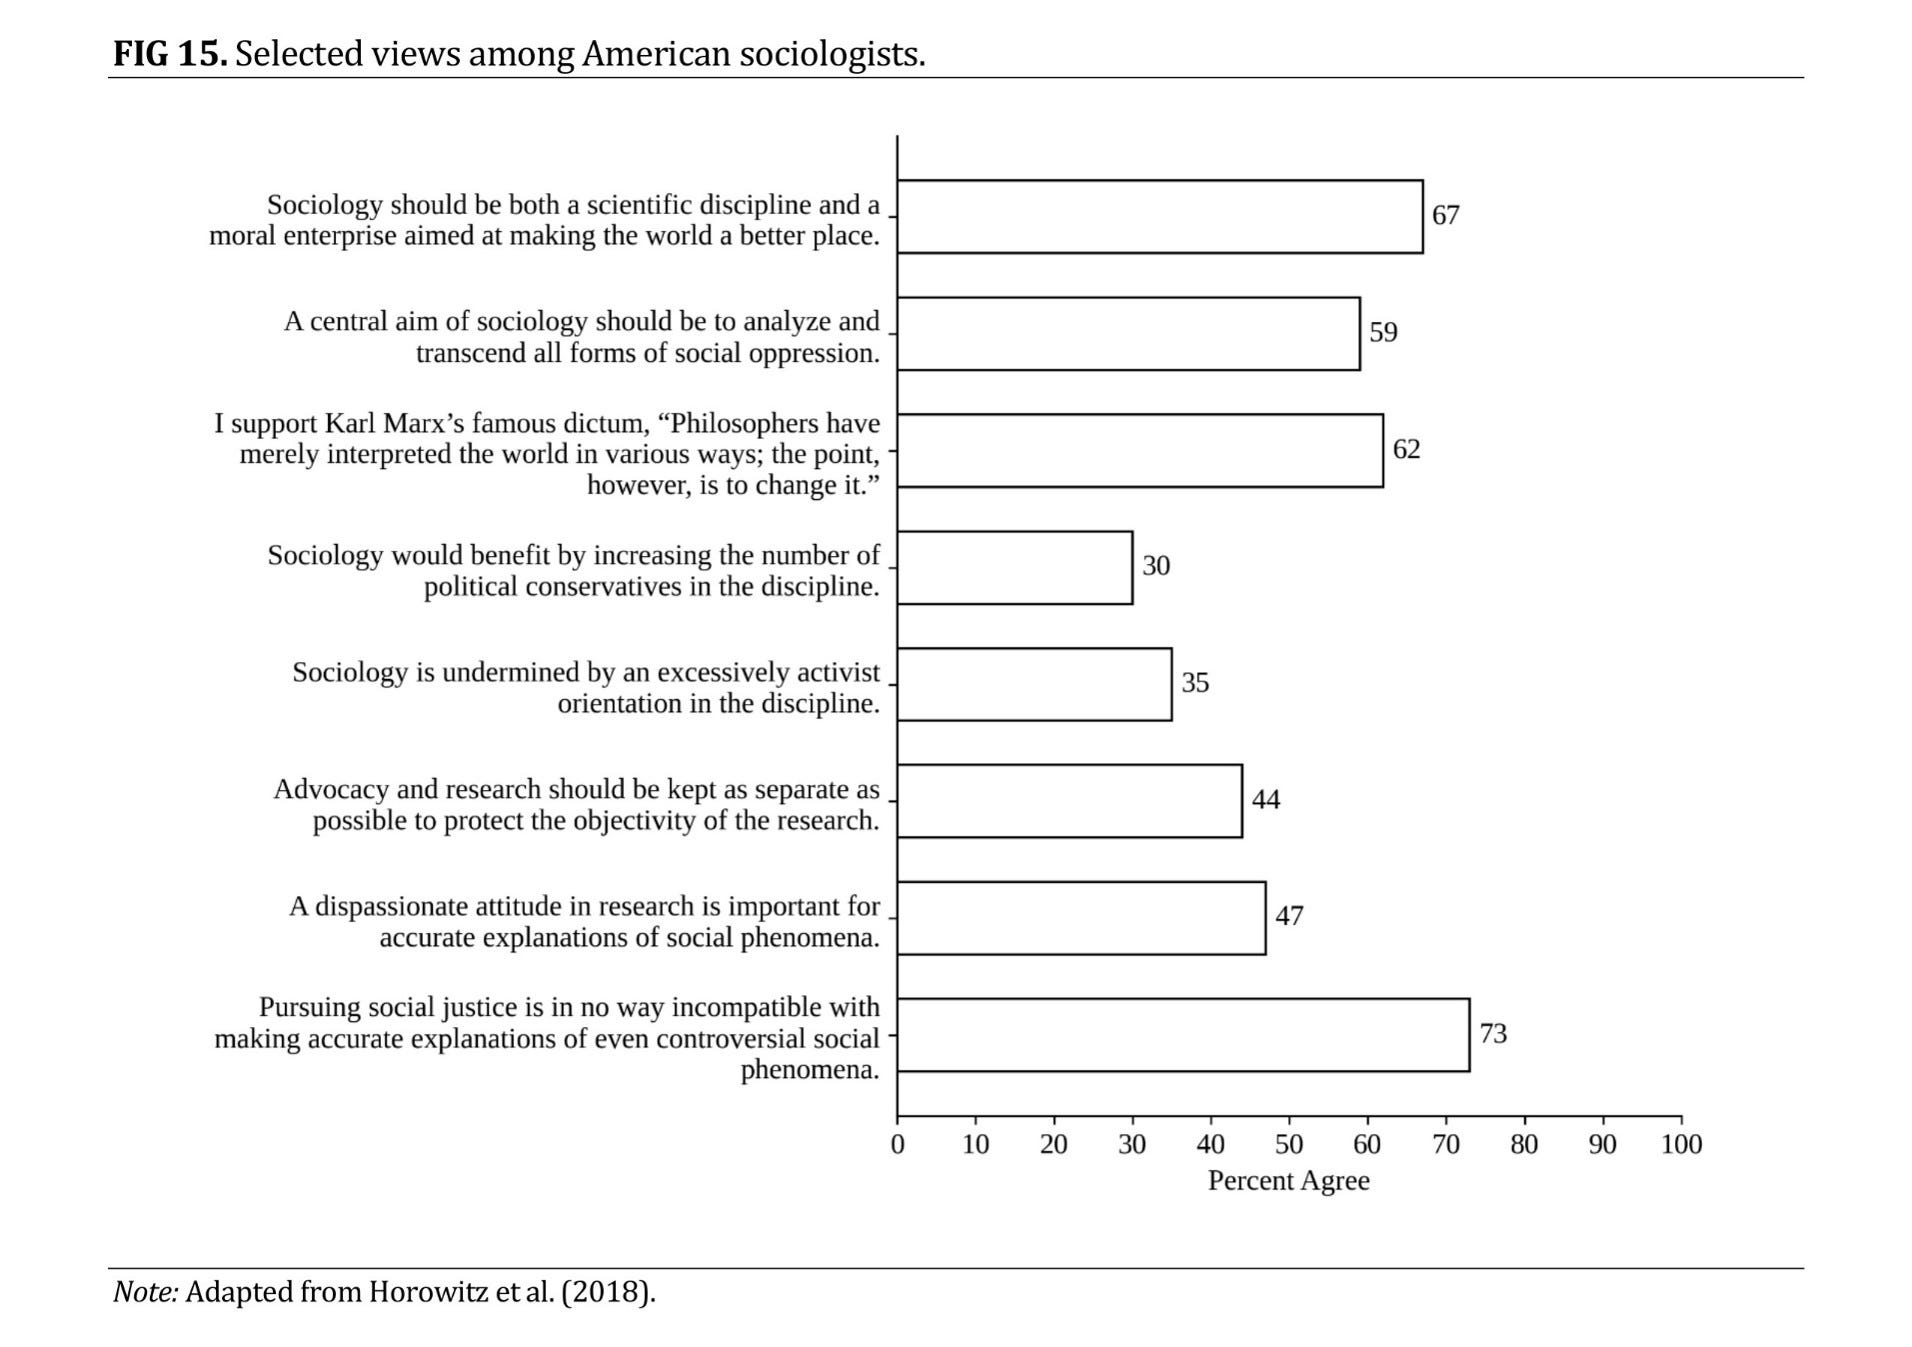
After Jacob Mackey and Lee Jussim and I submitted the final manuscript of our book, The Poisoning of the American Mind,81 to our publisher, we got a worrisome reply. The publisher had a few recommendations for revision—those are always expected and weren’t a problem. The one big request from the publisher was that we remove one chapter entirely.
The chapter in question, by Robert Lynch, argued that biological sex is not a social construct but a binary distinction rooted in gamete size that produces real, measurable, cross-culturally consistent differences between men and women in behavior, mate preferences, and occupational choices. His argument was both well-evidenced and fair to those taking a more social constructionist approach. He essentially makes a “don’t throw the baby out with the bath water” argument—in teaching and researching about the importance of gender, let us not pretend that sex differences don’t exist. Doing so undermines public trust in science, produces incoherent claims, and ultimately harms the people it claims to help.
We could not figure out why this chapter specifically needed to be cut—it was the only chapter the publisher questioned, and their reasoning was rather vague and confusing. So we said we would not do so as we did not believe cutting it was warranted. In response, they said they would no longer move forward with publishing the book.
After much discussion amongst the three of us, we caved. We agreed to take the chapter out (although it would eventually appear in a subsequent book of mine) rather than spend a year or two finding another publisher and going through another round of reviews. Given our acquiescence, George Mason University Press agreed to move forward with publication.
I believe this incident reflects a broader reluctance in many areas of academia to engage honestly with politically charged empirical questions. I suspect that if I quizzed academics on many hot-button issues, many would get the basic facts wrong.
Take the example of gender discrimination in the U.S. labor market. Recent meta-analyses of gender audit studies in hiring show that the overall picture on gender bias in hiring in the U.S. labor force is somewhere between gender neutral and slightly pro-woman.82 One of these recent meta-analyses, from Michael Schaerer and his coauthors,83 asked scholars to forecast the meta-analysis results. The academics in the survey were wrong in their predictions, even if they had previously published on gender and could therefore be expected to be up to date.
If the professors researching and teaching about gender don’t know, then how many students walk away from our programs without being made aware of this tremendous evidence of gender progress? Knowing the politics of the professoriate (refer back to Figure 2 above), how many students would walk away from our programs with the opposite impression?
The amount of misleading information being spread in academic spaces—where truth should be of the highest concern—is troubling. None of this is healthy. Let’s figure out how to fix it.
Let me close with a question that is on a lot of people’s minds right now. It is not whether artificial intelligence (AI) will disrupt the academy, but how fast, and how completely. This will seem unrelated at first. Bear with me.
A student with a capable AI system can already access a more patient, more personalized, infinitely available explanation of Durkheim or Weber or conflict theory than most lectures provide. That is not a criticism of individual professors. It is a structural observation about what technology now makes possible. However imperfect AI might be right now, it will be very good very soon.
Overlay this on the demographic crisis already bearing down on us. Fewer eighteen-year-olds, shrinking enrollments, institutions closing. You have not one disruption but two, arriving simultaneously, hitting sociology departments that were often already fragile.
For most of the history of social science, there has been an enormous asymmetry of information in the classroom. The professor has spent years, sometimes decades, immersed in a literature. The student has not. That asymmetry created a particular kind of authority. The professor could make empirical claims, characterize the state of evidence, describe what “the research shows,” and the student had essentially no mechanism to evaluate those claims in real time.
That asymmetry is about to collapse.
If AI keeps progressing, which I assume it will given the pace we’ve already seen, a student will be able to do the following, in real time during a classroom lecture, on a device in their pocket: identify every peer-reviewed study published on the claim the professor just made, run a meta-analytic summary of the effect sizes across those studies, flag methodological heterogeneity in the literature, note which findings have failed to replicate, surface the most prominent scholarly critics of the position the professor just articulated, and present the synthesis in a readable summary before the lecture is finished.
What happens to a professor at such a moment? For a careful, rigorous scholar who has accurately represented a genuinely complex and contested literature, the answer is: nothing bad. Credibility is enhanced. The professor becomes, in that student’s eyes, someone who can be trusted, because the machine confirmed that here was a scholar playing it straight.
Sometime soon AI will know if a professor has been, even unconsciously, selectively citing the literature, emphasizing confirmatory findings, eliding null results, misrepresenting effect sizes, ignoring replication failures, omitting methodological critiques, framing correlation as causation, presenting contested claims as settled consensus, or excluding scholars whose conclusions complicate the preferred narrative.
Tools that approximate this already exist. They are imperfect now. They will not be imperfect forever.
For decades, many of us sociologists operated with a certain faith, sincere and not unreasonable, that even when our field stood in the minority on a given question, even when our findings were unwelcome or our policy prescriptions ignored, we were simply ahead of the curve. The world would catch up. There was a Council of Economic Advisers in the White House shaping policy, and we told ourselves that what sociologists had to say was every bit as important, every bit as empirically grounded, and that eventually our seat at that table would come.
It never really did.
And one reason, not the only reason but one worth sitting with, is that we did not always hold ourselves to the standard of rigor that would have made that seat impossible to deny us.
Accountability like we have never seen is coming at a time when we are dealing with multiple other crises. The best thing we can do, for our students, for our discipline, and frankly for ourselves, is to make sure that when our work is examined, by human or machine, it checks out. I’m not sure how much credibility we have left, but failing to right this ship will exhaust it all.
In one of my favorite television shows, the HBO miniseries Chernobyl, the fictionalized version of Valery Legasov asserts that:
“Every lie we tell incurs a debt to the truth. Sooner or later that debt is paid.”84
I believe that sociology’s reckoning has arrived, and the debt has come due. Let us resolve never to borrow against the truth again.
This article first published in the Keystone Journal.
Images without attribution were created by the author using ChatGPT.
References
Alexender, M. (2012). The new Jim Crow: Mass incarceration in the age of colorblindness. The New Press.
Allcott, H., Diamond, R., Dubé, J.-P., Handbury, J., Rahkovsky, I., & Schnell, M. (2019). Food deserts and the causes of nutritional inequality. The Quarterly Journal of Economics, 134(4), 1793-1844.
Archer, J. (2004). Sex differences in aggression in real-world settings: A meta-analytic review. Review of General Psychology, 8(4), 291-322.
American Psychological Association (APA). (2019, April 10). Microaggressions. What they are, and how they are associated with adjustment outcomes. https://www.apa.org/pubs/highlights/spotlight/issue-133.
Arbeitskreis “Volkswirtschaftliche Gesamtrechnungen der Länder” (Arbeitskreis ) (2026). Volkswirtschaftliche Gesamtrechnungen der Länder [Data set]. Statistische Ämter des Bundes und der Länder. https://www.statistikportal.de/de/vgrdl.
Ballard, J. (2025, December 30). What Americans think are the best majors for students entering college today: Nursing and engineering. YouGov. https://today.yougov.com/politics/articles/53801-what-americans-think-are-the-best-majors-for-students-entering-college.
Banks, K. H., Kohn-Wood, L. P., & Spencer, M. (2006). An examination of the African American experience of everyday discrimination and symptoms of psychological distress. Community Mental Health Journal, 42, 555-570.
Beatty, L. G., & Snell, T. L. (2021). Profile of prison inmates, 2016 (NCJ 255037). Bureau of Justice Statistics, U.S. Department of Justice. https://bjs.ojp.gov/content/pub/pdf/ppi16.pdf.
Berggren, N., & Nilsson, T. (2013). Does economic freedom foster tolerance? Kyklos, 66(2), 177-207.
Blau, F. D., & Kahn, L. M. (2017). The gender wage gap: Extent, trends, and explanations. Journal of Economic Literature, 55(3), 789-865.
Blume, A. W., Lovato, L. V., Thyken, B. N., & Denny, N. (2012). The relationship of microaggressions with alcohol use and anxiety among ethnic minority college students in a historically white institution. Cultural Diversity and Ethnic Minority Psychology, 18, 45-54.
Board of Governors of the Federal Reserve System (FED) (2024). Economic well-being of U.S. households in 2023. https://www.federalreserve.gov/publications/files/2023-report-economic-well-being-us-households-202405.pdf.
Brady, D. (2021, April 30). American poverty should be measured relative to the prevailing standards of our time. The Century Foundation. https://tcf.org/content/report/american-poverty-measured-relative-prevailing-standards-time/.
Brady, D., & Burroway, R. (2012). Targeting, universalism, and single-mother poverty: A multilevel analysis across 18 affluent democracies. Demography, 49(2), 719-746.
Bundesregierung. (2017). Jahresbericht der Bundesregierung zum Stand der Deutschen Einheit 2017 (Bundestagsdrucksache 18/13520). Deutscher Bundestag. https://dserver.bundestag.de/btd/18/135/1813520.pdf.
Bundesregierung. (2019). Jahresbericht der Bundesregierung zum Stand der Deutschen Einheit 2019 (Bundestagsdrucksache 19/13500). Deutscher Bundestag. https://dserver.bundestag.de/btd/19/135/1913500.pdf.
Burkhauser, R. V., Larrimore, J., & Simon, K. I. (2012). A “second opinion” on the economic health of the American middle class. National Tax Journal, 65(1), 7-32.
Cantoni, E., & Pons, V. (2021). Strict ID laws don’t stop voters: Evidence from a U.S. nationwide panel, 2008–2018. The Quarterly Journal of Economics, 136(4), 2615-2660.
Cantu, E., & Jussim, L. (2021). Microaggressions, questionable science, and free speech. Texas Review of Law & Politics, 26(1), 217-267.
Cass, H. (2024). The Cass review: Independent review of gender identity services for children and young people — Final report. NHS England. https://cass.independent-review.uk/home/publications/final-report/.
Center on Poverty and Social Policy (CPSP). (2026). Historical Supplemental Poverty Measure data. Columbia University. https://povertycenter.columbia.edu/historical-spm-data.
Chamberlin, T. C. (1965). The method of multiple working hypotheses. Science, 148(3671), 754-759. https://doi.org/10.1126/science.148.3671.754. (Original work published 1890)
Chetty, R., Hendren, N., Kline, P., & Saez, E. (2014). Where is the land of opportunity? The geography of intergenerational mobility in the United States. The Quarterly Journal of Economics, 129(4), 1553-1623.
Clark, T. T., Salas-Wright, C. P., Vaughn, M. G., & Whitfield, K. E. (2015). Everyday discrimination and mood and substance use disorders: A latent profile analysis with African Americans and Caribbean Blacks. Addictive Behaviors, 40, 119-125.
Clemens, J., & Wither, M. (2019). The minimum wage and the Great Recession: Evidence of effects on the employment and income trajectories of low-skilled workers. Journal of Public Economics, 170, 53-67.
Congressional Budget Office. (2026, January). The distribution of household income, 2022. https://www.cbo.gov/publication/62300.
Cook, C., Diamond, R., Hall, J. V., List, J. A., & Oyer, P. (2021). The gender earnings gap in the gig economy: Evidence from over a million rideshare drivers. The Review of Economic Studies, 88(5), 2210-2238.
Cooper, P. (2025, September 10). Learning with their feet: Student enrollment trends in postsecondary education by college quality. American Enterprise Institute. https://www.aei.org/research-products/report/learning-with-their-feet-student-enrollment-trends-in-postsecondary-education-by-college-quality/.
Costa, P. L., McDuffie, J. W., Brown, S. E. V., He, Y., Ikner, B. N., Sabat, I. E., & Miner, K. N. (2022). Microaggressions: Mega problems or micro issues? A meta-analysis. Journal of Community Psychology, 51(1), 137-153.
Davies, D. (Host). (2012, January 16). Michelle Alexander: Jim Crow still exists in America [Radio broadcast transcript]. Fresh Air. National Public Radio. https://www.npr.org/transcripts/145175694.
Desmond, M. (2023). Poverty, by America. Crown.
Ekins, E. (2017). The state of free speech and tolerance in America. Cato Institute. https://www.cato.org/survey-reports/state-free-speech-tolerance-america.
Eppard, L. M. (2025). I think I was wrong about poverty. Contexts, 24(3), 84-87.
Eppard, L. M., Boatwright, D. A., & Hatvany, T. C. (2025). Cross-National comparisons of poverty and working-class earnings: How the United States measures up. Journal of Working-Class Studies, 10(1), 90-135.
Eppard, L. M., Mackey, J. L., & Jussim, L. (2024). The poisoning of the American mind. George Mason University Press.
Eppard, L. M., Mackey, J. L., & Jussim, L. (2026). Virtuous nonsense: Progressive America’s epistemic crisis. Pitchstone Publishing.
Fanelli, D. (2010). “Positive” results increase down the hierarchy of the sciences. PLOS ONE, 5(4), e10068. https://doi.org/10.1371/journal.pone.0010068.
Fanelli, D., & Glänzel, W. (2013). Bibliometric evidence for a hierarchy of the sciences. PLOS ONE, 8(6), e66938. https://doi.org/10.1371/journal.pone.0066938.
Finnigan, K. M., & Corker, K. S. (2016). Do performance avoidance goals moderate the effect of different types of stereotype threat on women’s math performance? Journal of Research in Personality, 63, 36-43.
Flore, P. C., & Wicherts, J. M. (2015). Does stereotype threat influence performance of girls in stereotyped domains? A meta-analysis. Journal of School Psychology, 53(1), 25-44.
Forman, J., Jr. (2012). Racial critiques of mass incarceration: Beyond the New Jim Crow. New York University Law Review, 87(1), 21-69. https://www.nyulawreview.org/wp-content/uploads/2018/08/NYULawReview-87-1-Forman_Jr.pdf.
Forrest-Bank, S. S., & Jenson, J. M. (2015). The relationship among childhood risk and protective factors, racial microaggression and ethnic identity, and academic self-efficacy and antisocial behavior in young adulthood. Children and Youth Services Review, 50, 64-74.
Foundation for Individual Rights in Education (FIRE). (2017). Bias Response Team Report 2017. https://www.thefire.org/research-learn/bias-response-team-report-2017.
Fryer, R. G., Jr. (2016). An empirical analysis of racial differences in police use of force (Working Paper No. 22399). National Bureau of Economic Research. https://doi.org/10.3386/w22399.
Galos, D. R., & Coppock, A. (2023). Gender composition predicts gender bias: A meta-reanalysis of hiring discrimination audit experiments. Science Advances, 9(18).
Gerrard, M., Stock, M. L., Roberts, M. E., Gibbons, F. X., O’Hara, R. E., Weng, C., & Wills, T. A. (2012). Coping with racial discrimination: The role of substance use. Psychology of Addictive Behaviors, 26, 550-560.
Goldin, C. (2014). A grand gender convergence: Its last chapter. American Economic Review, 104(4), 1091-1119.
Goymann, W., Brumm, H., & Kappeler, P. M. (2023). Biological sex is binary, even though there is a rainbow of sex roles. BioEssays, 45(2), e2200173. https://doi.org/10.1002/bies.202200173.
Gramlich, J. (2019, November 6). East Germany has narrowed economic gap with West Germany since fall of communism, but still lags. Pew Research Center. https://www.pewresearch.org/short-reads/2019/11/06/east-germany-has-narrowed-economic-gap-with-west-germany-since-fall-of-communism-but-still-lags/.
Guerino, P., Harrison, P. M., & Sabol, W. J. (2011). Prisoners in 2010 (NCJ 236096). Bureau of Justice Statistics, U.S. Department of Justice. https://bjs.ojp.gov/content/pub/pdf/p10.pdf.
Hasell, J., Rohenkohl, B., Arriagada, P., Ortiz-Ospina, E., & Roser, M. (2026). Poverty. Our World in Data. https://ourworldindata.org/poverty.
Heckman, J. J. (1998). Detecting discrimination. Journal of Economic Perspectives, 12(2), 101-116.
Hertz, T. (2005). Rags, riches, and race: The intergenerational economic mobility of black and white families in the United States. In S. Bowles, H. Gintis, & M. Osborne Groves (Eds.), Unequal chances: Family background and economic success (pp. 165-191). Russell Sage Foundation; Princeton University Press.
Hertz, T. (2006). Understanding mobility in America. Center for American Progress. https://www.americanprogress.org/article/understanding-mobility-in-america/.
Hilton, E. N., & Lundberg, T. R. (2021). Transgender women in the female category of sport: Perspectives on testosterone suppression and performance advantage. Sports Medicine, 51(2), 199-214.
Hollingsworth, D. W., Cole, A. B., O’Keefe, V. M., Tucker, R. P., Story, C. R., & Wingate, L. R. (2017). Experiencing racial microaggressions influences suicide ideation through perceived burdensomeness in African Americans. Journal of Counseling Psychology, 64, 104-111.
Horowitz, J. M. (2025, January 24). U.S. teens are less likely than adults to know a trans person, more likely to know someone who’s nonbinary. Pew Research Center. https://www.pewresearch.org/short-reads/2025/01/24/us-teens-are-less-likely-than-adults-to-know-a-trans-person-more-likely-to-know-someone-whos-nonbinary/.
Horowitz, M., Haynor, A., & Kickham, K. (2018). Sociology’s sacred victims and the politics of knowledge: Moral foundations theory and disciplinary controversies. The American Sociologist, 49(4), 459-495.
Hurd, N. M., Varner, F. A., Caldwell, C. H., & Zimmerman, M. A. (2014). Does perceived racial discrimination predict changes in psychological distress and substance use over time? An examination among Black emerging adults. Developmental Psychology, 50, 1910-1918.
Huynh, V. W. (2012). Ethnic microaggressions and the depressive and somatic symptoms of Latino and Asian American adolescents. Journal of Youth and Adolescence, 41, 831-846.
Iceland, J. (2023, October). The devil in the details: Matthew Desmond’s Poverty by America. Asterisk, (4). https://asteriskmag.com/issues/04/the-devil-in-the-details-matthew-desmond-s-poverty-by-america.
Institute for Crime & Justice Policy Research (ICJPR). (2026). Highest to lowest - Prison population total. World Prison Brief. https://www.prisonstudies.org/world-prison-data/highest-lowest/highest-lowest-prison-population-total.
Ioannidis, J. P. A. (2005). Why most published research findings are false. PLoS Medicine, 2(8), Article e124. https://doi.org/10.1371/journal.pmed.0020124.
Jardim, E., Long, M. C., Plotnick, R., van Inwegen, E., Vigdor, J., & Wething, H. (2022). Minimum-wage increases and low-wage employment: Evidence from Seattle. American Economic Journal: Economic Policy, 14(2), 263-314.
Jones, J. M. (2025, July 16). U.S. public trust in higher ed rises from recent low. Gallup. https://news.gallup.com/poll/692519/public-trust-higher-rises-recent-low.aspx.
Jones, N. (2026, April 1). Half of social-science studies fail replication test in years-long project. Nature. https://doi.org/10.1038/d41586-026-00955-5.
Kleven, H., Landais, C., & Søgaard, J. E. (2019). Children and gender inequality: Evidence from Denmark. American Economic Journal: Applied Economics, 11(4), 181-209.
Langbert, M., & Stevens, S. (2022). Partisan registration of faculty in flagship colleges. Studies in Higher Education, 47(8), 1750-1760. https://doi.org/10.1080/03075079.2021.1957815.
Lilienfeld, S. O. (2017a). Microaggressions: Strong claims, inadequate evidence. Perspectives on Psychological Science, 12(1), 138-169.
Lilienfeld, S. O. (2017b, June 23). The science of microaggressions: It’s complicated. Scientific American. https://www.scientificamerican.com/blog/observations/the-science-of-microaggressions-its-complicated/.
Lippens, L., Vermeiren, S., & Baert, S. (2023). The state of hiring discrimination: A meta-analysis of (almost) all recent correspondence experiments. European Economic Review, 151.
Lui, P. P. (2020). Racial microaggression, overt discrimination, and distress: (In)direct associations with psychological adjustment. The Counseling Psychologist, 48(4), 551-582.
Lui, P. P., & Quezada, L. (2019). Associations between microaggression and adjustment outcomes: A meta-analytic and narrative review. Psychological Bulletin, 145(1), 45-78.
Lukianoff, G., & Haidt, J. (2018). The coddling of the American mind: How good intentions and bad ideas are setting up a generation for failure. Penguin Books.
Luscombe, R. (2026, March 27). Florida axes sociology as required class at state universities in latest attack on ‘woke’. The Guardian. https://www.theguardian.com/us-news/2026/mar/27/florida-sociology-university-class.
Mackay, I. M. (2020, December 26). The Swiss cheese infographic that went viral. Virology Down Under. https://virologydownunder.com/the-swiss-cheese-infographic-that-went-viral/.
Martinez, J. D., Ramankutty, N., Mehrabi, Z., & Hertel, T. W. (2024). A modelled estimate of food access within countries shows that inequality within countries has increased despite rising equality between countries. Global Food Security, 41, 1-10.
Mattern, K. D., Patterson, B. F., Shaw, E. J., Kobrin, J. L., & Barbuti, S. M. (2008). Differential validity and prediction of the SAT (College Board Research Report No. 2008-4). The College Board. https://files.eric.ed.gov/fulltext/ED562614.pdf.
Mazin, C. (Writer), & Renck, J. (Director). (2019). Chernobyl [TV miniseries]. HBO; Sky UK.
McIntyre, L. (2015). Respecting truth: Willful ignorance in the internet age. Routledge.
Merton, R. K. (1973). The normative structure of science. In N. W. Storer (Ed.), The sociology of science: Theoretical and empirical investigations (pp. 267-278). University of Chicago Press. (Original work published 1942)
Middlebury College. (2026). Community Bias Response Team. https://www.middlebury.edu/community-bias-response-team.
Mooney, C. (2014, October 28). Liberals deny science, too. The Washington Post. https://www.washingtonpost.com/news/wonk/wp/2014/10/28/liberals-deny-science-too/.
Munafò, M. R., Nosek, B. A., Bishop, D. V. M., Button, K. S., Chambers, C. D., Percie du Sert, N., Simonsohn, U., Wagenmakers, E.-J., Ware, J. J., & Ioannidis, J. P. A. (2017). A manifesto for reproducible science. Nature Human Behaviour, 1(1), Article 0021.
Nadal, K. L. (2011). The Racial and Ethnic Microaggressions Scale (REMS): Construction, reliability, and validity. Journal of Counseling Psychology, 58(4), 470-480.
Nadal, K. L., Griffin, K. E., Wong, Y., Hamit, S., & Rasmus, M. (2014a). The impact of racial microaggressions on mental health: Counseling implications for clients of color. Journal of Counseling & Development, 92, 57-66.
Nadal, K. L., Wong, Y., Griffin, K. E., Davidoff, K., & Sriken, J. (2014b). The adverse impact of racial microaggressions on college students’ self-esteem. Journal of College Student Development, 55, 461-474.
National Academies of Sciences, Engineering, and Medicine (NAS). (2016). Genetically engineered crops: Experiences and prospects. The National Academies Press. https://doi.org/10.17226/23395.
National Center for Education Statistics (NCES). (2024). International educational attainment. Condition of Education. U.S. Department of Education, Institute of Education Sciences. https://nces.ed.gov/programs/coe/indicator/cac/intl-ed-attainment.
Neumark, D., & Shirley, P. (2022). Myth or measurement: What does the new minimum wage research say about minimum wages and job loss in the United States? Industrial Relations: A Journal of Economy and Society, 61(4), 384-417.
Noé-Bustamante, L., Martinez, G., & Lopez, M. H. (2024, September 12). Latinx awareness has doubled among U.S. Hispanics since 2019, but only 4% use it. Pew Research Center. https://www.pewresearch.org/race-and-ethnicity/2024/09/12/latinx-awareness-has-doubled-among-u-s-hispanics-since-2019-but-only-4-percent-use-it/.
OECD. (2025). Education at a glance 2025: OECD indicators. OECD Publishing. https://www.oecd.org/content/dam/oecd/en/publications/reports/2025/09/education-at-a-glance-2025_c58fc9ae/1c0d9c79-en.pdf.
OECD. (2026). Housing overcrowding. https://www.oecd.org/en/data/indicators/housing-overcrowding.html.
O’Keefe, V. M., Wingate, L. R., Cole, A. B., Hollingsworth, D. W., & Tucker, R. P. (2015). Seemingly harmless racial communications are not so harmless: Racial microaggressions lead to suicidal ideation by way of depression symptoms. Suicide & Life-Threatening Behavior, 45, 567-576.
Oswald, F. L., Mitchell, G., Blanton, H., Jaccard, J., & Tetlock, P. E. (2013). Predicting ethnic and racial discrimination: A meta-analysis of IAT criterion studies. Journal of Personality and Social Psychology, 105(2), 171-192.
Our World in Data (OWD). (2026a). https://ourworldindata.org/
Our World in Data (OWD). (2026b). GDP per capita [Data set]. https://ourworldindata.org/grapher/gdp-per-capita-worldbank.
Park, S. Y., & Oh, E. (2025). Getting a foot in the door: A meta-analysis of U.S. audit studies of gender bias in hiring. Sociological Science, 12, 26-50.
Pew Research Center. (2025, February 26). Americans have grown more supportive of restrictions for trans people in recent years. https://www.pewresearch.org/short-reads/2025/02/26/americans-have-grown-more-supportive-of-restrictions-for-trans-people-in-recent-years/.
Pfaff, J. F. (2017). Locked in: The true causes of mass incarceration and how to achieve real reform. Basic Books.
Platt, J. R. (1964). Strong inference. Science, 146(3642), 347-353. https://doi.org/10.1126/science.146.3642.347.
Psychology Today. (2026). Replication crisis. https://www.psychologytoday.com/us/basics/replication-crisis.
Ruuska, S.-M., Tuisku, K., Holttinen, T., & Kaltiala, R. (2024). All-cause and suicide mortalities among adolescents and young adults who contacted specialised gender identity services in Finland in 1996-2019: A register study. BMJ Mental Health, 27(1), e300940.
Sackett, P. R., Borneman, M. J., & Connelly, B. S. (2008). High-stakes testing in higher education and employment: Appraising the evidence for validity and fairness. American Psychologist, 63(4), 215-227.
Savolainen, J. (2025a). The methodological stagnation of sociology is related to its left-wing skew. Theory and Society, 54(5), 731-744.
Savolainen, J. (2025b, October 22). Left-wing bias is corrupting sociology. The Chronicle of Higher Education. https://www.chronicle.com/article/left-wing-bias-is-corrupting-sociology.
Sawyer, W., Nam-Sonenstein, B., & Wagner, P. (2026, March 11). Mass incarceration: The whole pie 2026. Prison Policy Initiative. https://www.prisonpolicy.org/reports/pie2026.html.
Schaerer, M., du Plessis, C., Nguyen, M. H. B., van Aert, R. C. M., Tiokhin, L., Lakens, D., Clemente, E. G., Pfeiffer, T., Dreber, A., Johannesson, M., Clark, C. J., Gender Audits Forecasting Collaboration, & Uhlmann, E. L. (2023). On the trajectory of discrimination: A meta-analysis and forecasting survey capturing 44 years of field experiments on gender and hiring decisions. Organizational Behavior and Human Decision Processes, 179.
Sinozich, S., & Langton, L. (2014). Rape and sexual assault victimization among college-age females, 1995–2013 (NCJ 248471). U.S. Department of Justice, Bureau of Justice Statistics. https://bjs.ojp.gov/library/publications/rape-and-sexual-assault-among-college-age-females-1995-2013.
Sorokin, P. A. (1956). Fads and foibles in modern sociology and related sciences. Henry Regnery.
Sowell, T. (2019). Discrimination and disparities. Basic Books.
Statistisches Bundesamt. (2026). Volkswirtschaftliche Gesamtrechnungen, Inlandsprodukt. https://www.destatis.de/DE/Themen/Wirtschaft/Volkswirtschaftliche-Gesamtrechnungen-Inlandsprodukt/_inhalt.html.
Sue, D. W., Capodilupo, C. M., Nadal, K. L., & Torino, G. C. (2008). Racial microaggressions and the power to define reality. American Psychologist, 63(4), 277-279.
Thai, C. J., Lyons, H. Z., Lee, M. R., & Iwasaki, M. (2017). Microaggressions and self-esteem in emerging Asian American adults: The moderating role of racial socialization. Asian American Journal of Psychology, 8, 83-93.
Thomas, K. R. (2008). Macrononsense in multiculturalism. American Psychologist, 63(4), 274-275.
Torres, L., Driscoll, M. W., & Burrow, A. L. (2010). Racial microaggressions and psychological functioning among highly achieving African-Americans: A mixed-methods approach. Journal of Social and Clinical Psychology, 29, 1074-1099.
Wai, J., Brown, M. I., & Chabris, C. F. (2018). Using standardized test scores to include general cognitive ability in education research and policy. Journal of Intelligence, 6(3).
Watson, D., & Clark, L. A. (1984). Negative affectivity: The disposition to experience aversive emotional states. Psychological Bulletin, 96(3), 465-490.
Williams, M. T. (2020). Microaggressions: Clarification, evidence, and impact. Perspectives on Psychological Science, 15(1), 3-26.
Williams, M. T., Kanter, J. W., & Ching, T. H. W. (2018a). Anxiety, stress, and trauma symptoms in African Americans: Negative affectivity does not explain the relationship between microaggressions and psychopathology. Journal of Racial and Ethnic Health Disparities, 5, 919-927.
Williams, M. T., Printz, D., & DeLapp, R. C. T. (2018b). Assessing racial trauma in African Americans with the Trauma Symptoms of Discrimination Scale. Psychology of Violence, 8, 735-747.
Williams, M. T., Taylor, R. J., Mouzon, D. M., Oshin, L. A., Himle, J. A., & Chatters, L. M. (2017). Discrimination and symptoms of obsessive–compulsive disorder among African Americans. American Journal of Orthopsychiatry, 87(6), 636-645.
Wimer, C., Fox, L., Garfinkel, I., Kaushal, N., & Waldfogel, J. (2016). Progress on poverty? New estimates of historical trends using an anchored Supplemental Poverty Measure. Demography, 53(4), 1207-1218.
World Bank. (2026). Income or consumption of the poorest 10% (versions 20260324_2021 and 20260324_2017) [Data set]. Poverty and Inequality Platform. Adapted by Our World in Data. https://ourworldindata.org/grapher/daily-income-or-consumption-of-the-poorest-10-marimekko?time=2013.
1 Connors Institute for Nonpartisan Research & Civic Engagement at Shippensburg University.
2 The social sciences have, after all, long been characterized by critics as “soft” disciplines: “It could be more than a coincidence that physicist Jan Hendrik Schön’s duplicated graphs took less than a year to be discovered, whereas social psychologist Diederik Stapel could fabricate his way through 20 years of star-level career, with no one ever challenging his work. Perhaps, soft sciences would progress more rapidly if their practitioners were rewarded not based on immediacy and impact, but on methodological transparency and successful replication” (Fanelli & Glänzel, 2013).
3 See two of my recent books, The Poisoning of the American Mind (Eppard et al., 2024) and Virtuous Nonsense (Eppard et al., 2026), as well as some of my recent articles on the topic.
4 Watson & Clark, 1984.
5 Microaggressions are often defined as “acts, often facially innocuous, that convey subtle animus or bias against someone in a traditionally marginalized group. . . Combating microaggressions is part of a greater project of rooting out the purportedly most insidious forms of racism today: the subtle forms embedded in culture that we take for granted, such as language habits that reinforce pernicious racial stereotypes” (Cantu & Jussim, 2021, p. 218).
6 Costa et al., 2022.
7 In fact, many studies categorized examples of overt prejudice/discrimination as microaggressions, a problem which plagues this type of research—see Lilienfeld (2017a) and Cantu & Jussim (2021).
8 Lilienfeld, 2017a, p. 153.
9 Lui (2020), for instance, found that once neuroticism was included in her model, neither microaggressions nor overt discrimination predicted psychological distress among African Americans, and that overt discrimination was negatively associated with drinking problems: “Once neuroticism was included in the models, neither microaggression nor overt discrimination were statistically significant in accounting for variances in psychological distress, negative affect, and alcohol consumption. Overt discrimination was negatively associated with drinking problems as distinct from neuroticism, but microaggression did not incrementally explain the variance of drinking problems. . . Psychological distress directly accounted for the variances of negative affect, alcohol consumption, and drinking problems, but microaggression and overt discrimination did not directly or indirectly predict these outcomes” (p. 569). This is one of the few studies I am aware of that controls for overt discrimination and something close to negative affectivity/emotionality. With these controls, microaggression effects washed out entirely.
10 Scott Lilienfeld (2017b) argued that “[I]t is all but impossible to determine the degree to which people’s reactions to microaggressions are attributable to these stimuli themselves as opposed to people’s subjective reactions to them. . . For one thing, microaggressions as Sue and others conceptualize them lie entirely in the eyes of the beholder. Therefore, if a person feels ‘microaggressed’ against, he or she is automatically deemed to be the victim of a microaggression.”
11 Just as Priscilla Lui and Lucia Quezada demonstrated in an earlier meta-analysis: “[N]ot many studies considered individual difference factors such as vulnerability and reactivity to stress” (APA, 2019).
12 Costa et al., 2022, pp. 149-150.
13 From Jukka Savolainen: “In a sample of recent articles from top journals, the share of empirical articles with a causal design was the highest in economics (72.6%), followed by political science (60.7%), and psychology (50%). In sociology, the share of empirical articles consistent with the principles of the credibility revolution was below 10%. Once again, sociology stands out as the outlier, lagging behind this important movement for methodological integrity” (2025a, p. 739).
14 I say “more compelling” because it is more recent and included more studies than the earlier 2019 meta-analysis from Lui and Quezada (APA, 2019).
15 Cantu & Jussim note that “While interdisciplinarity has greatly enriched the collective corpus of legal scholarship over the past several decades, it comes with its risks. One risk is that, after some claim becomes a popular research topic in another field, but before research establishes that claim as valid, it will take off like wildfire in legal scholarship without sufficient gatekeeping. This is what has happened with microaggressions: educators, scholars, and administrators have accepted the [current microaggression construct] as valid even though psychologists have not established its scientific legitimacy” (2021, p. 220). While Cantu & Jussim were talking about legal scholarship, I believe this interdisciplinary problem also applies to sociology—we often build classroom lectures and published research upon a foundation of questionable claims from other fields (like psychology) that we incorrectly assume have a solid evidence base.
16 Merton, 1973, p. 270.
17 Nadal, 2011, p. 474.
18 Ibid.
19 Ibid.
20 e.g., Nadal, 2011.
21 Williams, 2020, p. 19. Along the same lines, Derald Wing Sue and his colleagues (Sue et al., 2008) responded to Kenneth Thomas’s (2008) critiques by writing “As a privileged White male, Thomas failed to understand how European Americans have historically had the power to impose their own reality and define the reality of those with lesser power. That is perhaps one of the reasons why Thomas tried to impose his own reality so freely in his response” (p. 277). This does not seem to me like an appropriate scientific exchange about methodological concerns.
22 Cantu & Jussim, 2021, p. 220.
23 Ibid, p. 221.
24 See FIRE’s (2017) report for more on “bias response teams.”
25 1965, pp. 754-755.
26 1964, p. 350.
27 Fanelli (2010) examined 2,434 papers across a wide range of academic disciplines and found that the social sciences report a greater proportion of positive findings and face fewer constraints on conscious and unconscious biases: “[I]n some fields of research (which we will henceforth indicate as ‘harder’) data and theories speak more for themselves, whereas in other fields (the ‘softer’) sociological and psychological factors—for example, scientists’ prestige within the community, their political beliefs, their aesthetic preferences, and all other non-cognitive factors—play a greater role in all decisions made in research, from which hypothesis should be tested to how data should be collected, analyzed, interpreted and compared to previous studies.”
28 Jones, 2026.
29 For a very brief overview, see Psychology Today (2026). For deeper explorations, see Ioannidis (2005) or Munafò et al. (2017).
30 See Jones (2025) as an example.
31 Instead of treating them as threats to be neutralized.
32 This goes for the classroom, in research, and the public square—we need strong disciplinary norms against overclaims and inappropriate causal language.
33 Cantu & Jussim write that “The process [of idea laundering] at its most extreme works like this. Some idea is presented or even claimed to be true in a book chapter or article, with little or no evidence. . . The idea, now published in a peer reviewed journal, can now be cited by other researchers publishing in other peer reviewed journals as ‘evidence’ for the validity of the claim. . . [N]ew researchers can then further cite one another’s peer reviewed publications in support of the claim. The [current microaggression construct] appears to be a product of idea laundering because it is currently ricocheting through psychology scholarship and the broader culture as if its validity has already been scientifically established. The problem is, discovery that the emperor has no clothes (at least not yet) requires the deep dive into primary sources that most writers are not inclined to, or don’t have time to, undertake” (2021, p. 223).
34 “Each scholar suffers from confirmation bias—the tendency to search vigorously for evidence that confirms what one already believes. One of the most brilliant features of universities is that, when they are working properly, they are communities of scholars who cancel out one another’s confirmation biases. Even if professors often cannot see the flaws in their own arguments, other professors and students do them the favor of finding such flaws. The community of scholars then judges which ideas survive the debate. We can call this process institutionalized disconfirmation. The institution (the academy as a whole, or a discipline, such as political science) guarantees that every statement offered as a research finding—and certainly every peer-reviewed article—has survived a process of challenge and vetting. That is no guarantee that it is true, but it is a reason to think that the statement is likely to be more reliable than alternative statements made by partisan think tanks, corporate marketers, or your opinionated uncle. It is only because of institutionalized disconfirmation that universities and groups of scholars can claim some authority to be arbiters of factual questions” (Lukianoff & Haidt, 2018, p. 109).
35 Dedicated funding in these areas would help a great deal.
36 Being able to publicly access the anonymous peer review reports for published research would be good for scientific transparency. It would also be helpful if the titles, abstracts, and peer review reports (or the rationale for desk rejections) for rejected manuscripts were made publicly accessible in order to examine possible bias on the part of academic journals. This may not be possible, given how it might negatively impact reviewer candor and authors’ reputations, so it would have to be done with great care.
37 Savolainen, 2025b.
38 In the Costa et al. (2022) meta-analysis discussed earlier, the authors argued against causal inference in their limitations section. As another example, in Monnica Williams’s 2020 response to Scott Lillienfeld’s critiques, she asserts that “Microaggressions Exert an Adverse Impact on Mental Health,” and then goes on to cite 15 largely cross-sectional studies that (a) do not control for negative affectivity/emotionality and hostile attribution bias and (b) do not establish causal inference (see Appendix A).
39 For an example of how this is contested, see Goymann et al. (2023).
40 See for example Oswald et al. (2013).
41 See for example Hertz (2005, 2006) and Chetty et al. (2014).
42 Table 2 includes the 15 claims that I presented in my NCSA address in April 2026.
43 2015, p. 135.
44 Ballard, 2025.
45 See, for instance, what is happening to sociology at Florida universities (Luscombe, 2026).
46 For instance, eliminating sociology entirely from the curriculum, or replacing it with a “conservative” sociology that makes the same partisan mistakes but just in the opposite direction, are no solutions at all.
47 Jones, 2025.
48 Alexander, 2012, p. 6.
49 See ICJPR (2026) and Sawyer et al. (2026). My calculations, based on Prison Policy Initiative (Sawyer et al., 2026) data, is that around 20% of the total (federal, state, and local) incarcerated population today is locked up for drug offenses, while the largest group is locked up for violent offenses (around 46%).
50 2012, p. 8.
51 Guerino et al., 2011.
52 2012, p. 7.
53 Sawyer et al., 2026.
54 Beatty & Snell, 2021.
55 As another example, in a 2012 NPR interview Alexander claimed that “People are swept into the criminal justice system, particularly in poor communities of color, at very early ages. . . So they’re shuttled from their decrepit, underfunded schools to brand-new, high-tech prisons; typically for fairly minor, nonviolent crimes, often drug offenses” (Davies, 2012).
56 These are hardly the only problems with her arguments. In the Introduction she claims that the U.S. had crime rates similar to Finland’s and Germany’s in the 1980s and 1990s. That’s true only for selected crime categories; on homicide and serious violent crime, U.S. rates were several times higher. She doesn’t tell the reader which categories her comparison rests on (Alexander, 2012, p. 7).
57 2012, p. 48.
58 Hasell et al., 2026.
59 Calculations made by author using data obtained through email correspondence with lead author Juan Diego Martinez (Martinez et al., 2024). Data available by request, as per the “Data availability” section of the online version of the article, from Martinez.
60 World Bank, 2026.
61 Hasell et al., 2026.
62 In fact, bottom decile calorie access/day is strongly correlated (r = -0.66) with absolute poverty, but only moderately correlated (r = -0.36) with relative poverty. In a regression model, absolute poverty alone explained 43.3% of the variance in bottom decile calorie access/day, with relative poverty adding only 0.4% more variance (43.7%) when added into the model. In the second block, absolute poverty had a standardized coefficient of -0.706 (p < 0.001), while relative poverty (standardized coefficient of 0.077) was not statistically significant (p = 0.653).
63 Eppard, 2025.
64 Brady, 2021.
65 Hasell et al., 2026.
66 Desmond, 2023, p. 6.
67 Hasell et al., 2026.
68 Desmond, 2023, pp. 24-25.
69 Iceland, 2023.
70 Desmond, 2023, p. 95.
71 Ibid, p. 99.
72 See Tax Foundation (2023) as cited in Iceland (2023).
73 CBO, 2026.
74 Desmond, 2023, p. 36.
75 Ibid, pp. 36-37.
76 Brady & Burroway, 2012.
77 See Brady & Burroway (2012), Desmond (2023), and Iceland (2023).
78 Iceland, 2023.
79 See Noé-Bustamante et al., 2024. All over campus I’ve seen the word Latinx—on fliers, in syllabi, in campus talks, and certainly in research. I recently added up the references to Latinos in a recent ASA program and wasn’t all that surprised to see that Latinx and Latine outpaced Latino and Hispanic, despite the fact that Latinos consistently report not only that they prefer the terms “Latino” and “Hispanic”—but that they overwhelmingly reject these newer terms.
80 Mooney, 2014.
81 Eppard et al., 2024.
82 See Galos & Coppock (2023); Lippens et al. (2023); Park & Oh (2025); and Schaerer et al. (2023).
83 Schaerer et al., 2023.
84 Mazin & Renck, 2019.
Commenting
Before commenting, please review my commenting guidelines. They will prevent your comments from being deleted. Here are the core ideas:
Don’t attack or insult the author or other commenters.
Stay relevant to the post.
Keep it short.
Do not dominate a comment thread.
Do not mindread, its a loser’s game.
Don’t tell me how to run Unsafe Science or what to post. (Guest essays are welcome and inquiries about doing one should be submitted by email).
 | A guest post by
|
As somebody that works in (and debunks) research within the biological and medical sciences, I find it fascinating how much overlap I see between what you describe and what I find in very different disciplines.
With that first decoy example having a correlation of r = -0.29... Even if the study was well performed, a correlation <0.30 is weak at best. And, I would argue, it is often the result of statistical noise that is bound to be found when one does a sufficient number of analyses. Indeed, I have shown this in my own work debunking the concept of "digit ratio" (a field in most correlations are in the 0.2 to 0.3 magnitude).
So many other examples of weak science (or even theory) being supported as facts.
This is why, as somebody who values science and the scientific method, I am skeptical anytime I see research quoted or a headline proclaiming "new study finds" about any topic. I want to trust science and scientists, I really do. But there are so many incentives to confirm hypotheses, rather than rigorously test them, that a healthy sense of skepticism is necessary.
We need to actually dig into the methods and results ourselves to critically evaluate them, otherwise it's hard to know if what is being summarized accurately reflects the research itself. That includes evaluating the authors' own conclusions to determine if they are directly supported by the data or reaching too far.
An absolutely brilliant piece that, I think, correctly highlights the main problems we face as social science researchers. Our problem is not that results can't be replicated. It's that they CAN be replicated...but the methods were bad to begin with.
I did not agree with everything in here, but I will be recommending this piece to anyone who wonders why so many of us academics believe the social sciences are going off the moorings; or anyone interested in real facts about poverty and capitalism.
The opening transgender/microaggressions reversal was freakin' genius. I hope psychologists in my own field are listening! Thanks for a terrific piece.